Fig. 1.
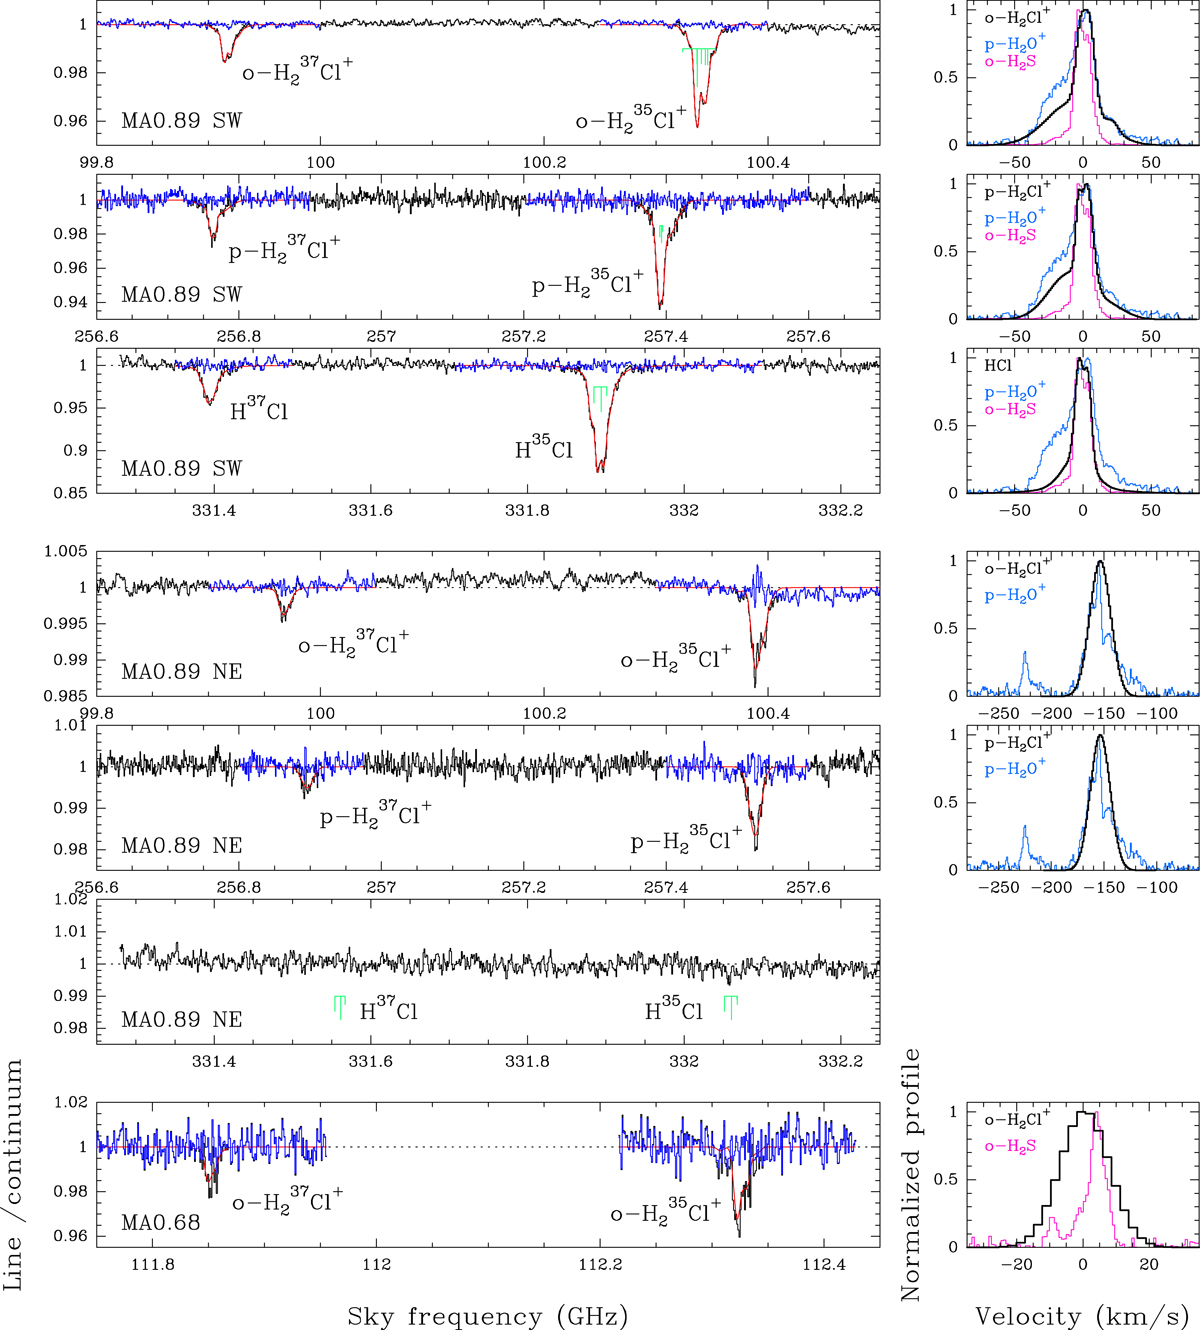
Absorption spectra of chlorine-bearing species observed toward MA0.89 SW (top three panels), MA0.89 NE (middle three panels), and MA0.68 (bottom panel). Hyperfine structure is indicated in green for 35Cl-isotopologs of each line toward MA0.89 SW. Hyperfine structure was deconvolved by fitting multiple Gaussian velocity components; these fits are shown in red on top of spectra, with residuals shown in blue. On the right, deconvolved opacity profiles (assuming optically thin lines with fc = 1, as explained in Sect. 3), normalized to their peak opacity, are shown, together with opacity profiles of some other species for comparison. The profile of p-H2O+ is of the strongest hyperfine component of the 110–101 transition, at rest frequency of 607 GHz. The profile of o-H2S is the 110–101 transition, at rest frequency of 168.8 GHz, which was observed simultaneously with o-H2Cl+ in the same tuning.
Current usage metrics show cumulative count of Article Views (full-text article views including HTML views, PDF and ePub downloads, according to the available data) and Abstracts Views on Vision4Press platform.
Data correspond to usage on the plateform after 2015. The current usage metrics is available 48-96 hours after online publication and is updated daily on week days.
Initial download of the metrics may take a while.