Fig. 8.
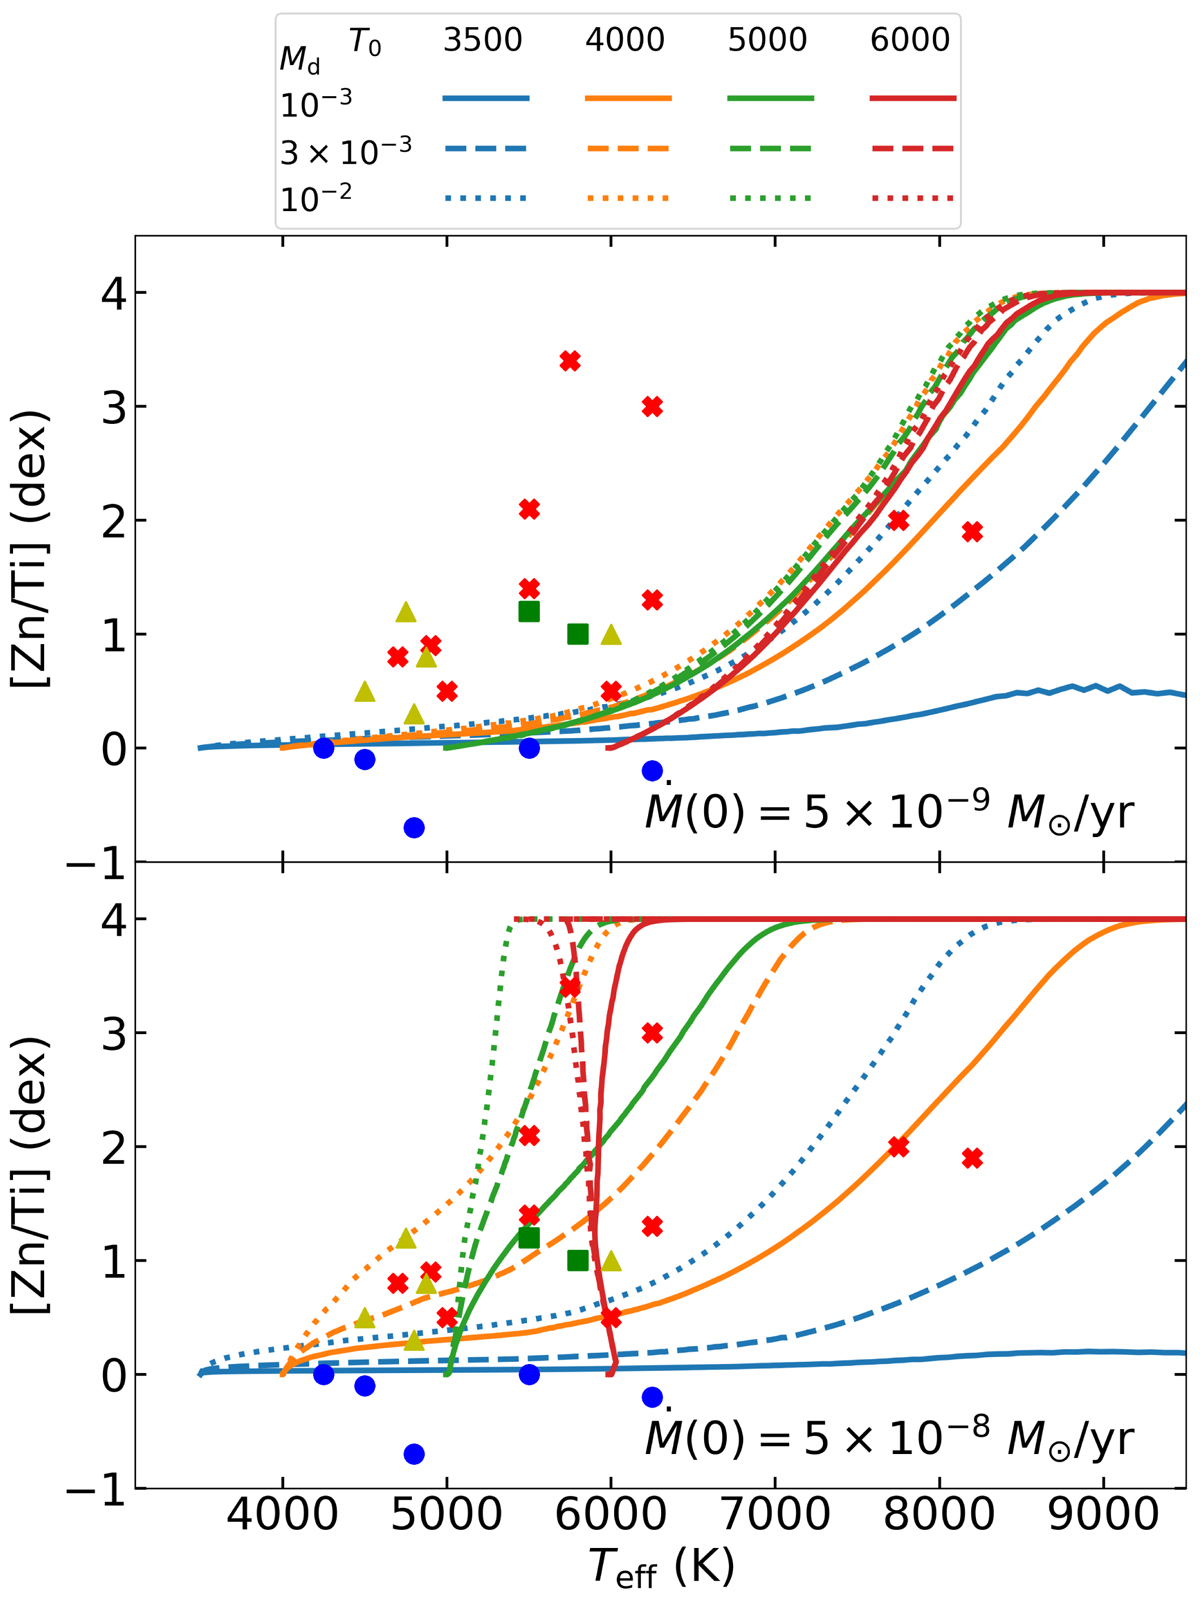
MESA models of post-RGB stars with a core mass of 0.40 M⊙ and initial accretion rates of 5 × 10⁻⁹ M⊙ yr−1 (upper panel) and 5 × 10⁻⁸ M⊙ yr−1 (lower panel). Curves with different colours represent different starting temperatures, while linestyles distinguish different disc masses. Units of Md and T0 are M⊙ and K, respectively. Observations for stars with L < 2500 L⊙ are shown as symbols, where similar to Fig. 4 non-depleted objects are blue circles, plateau-type objects are yellow triangles, and saturated objects are red crosses. Objects with uncertain depletion patterns are denoted by green squares. If a star does not have a Zn measurement, S is used instead, while if a star does not have a Ti measurement, we used Sc or Fe to plot the [Zn/Ti] ratio (Table A.1).
Current usage metrics show cumulative count of Article Views (full-text article views including HTML views, PDF and ePub downloads, according to the available data) and Abstracts Views on Vision4Press platform.
Data correspond to usage on the plateform after 2015. The current usage metrics is available 48-96 hours after online publication and is updated daily on week days.
Initial download of the metrics may take a while.