Fig. 6.
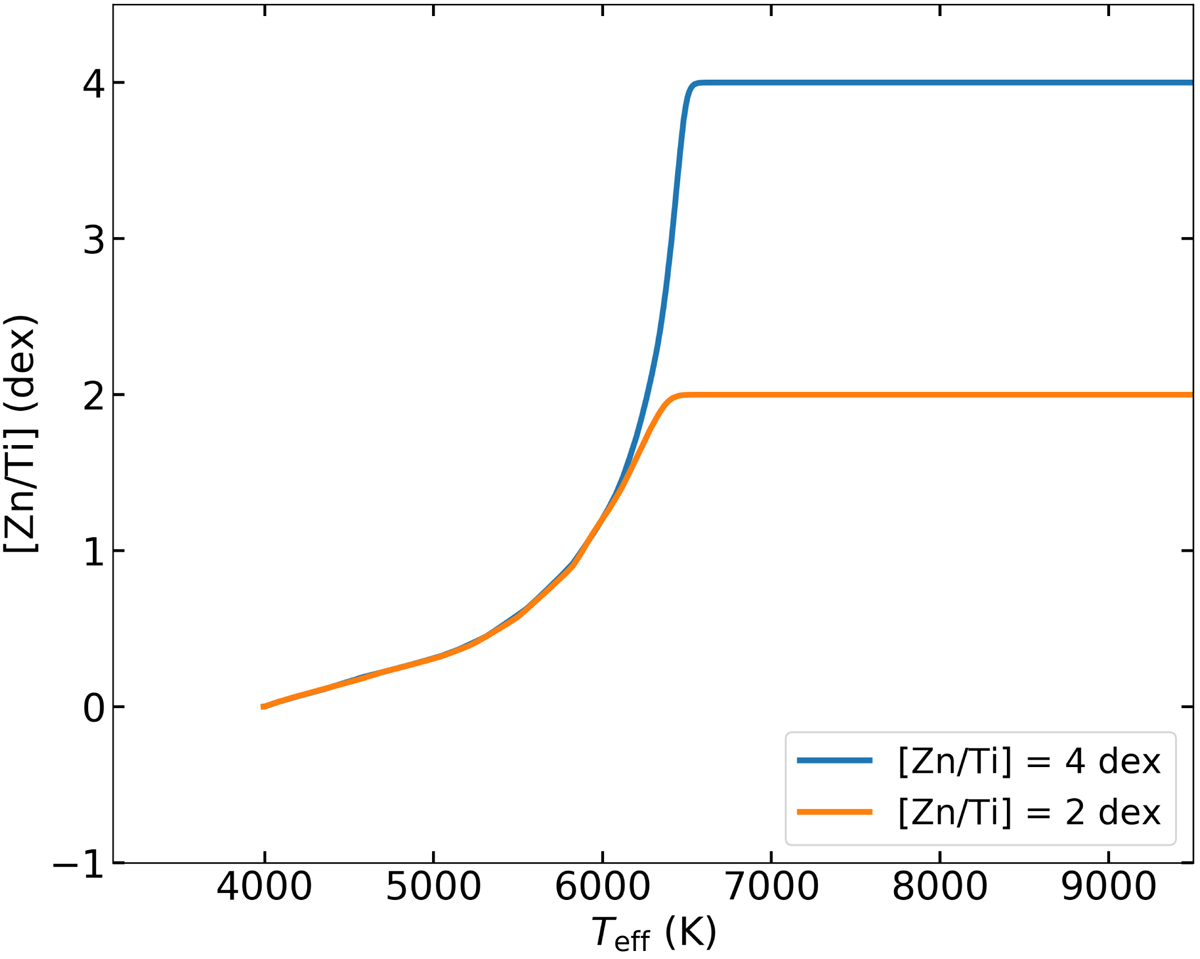
Two models of a 0.55-M⊙ star with different maximum depletion abundances. The evolution is plotted with respect to effective temperature of the star and the [Zn/Ti] ratio in the photosphere of the model. The blue curve with [Zn/Ti] = 4 dex is the accretion abundance from Fig. 2 which is used throughout all of our MESA models. The orange curve is the same model, but the accretion abundances are scaled to [Zn/Ti] = 2 dex. The accretion parameters used in both models are Ṁ(0) = 1.5 × 10⁻⁷ M⊙ yr−1, Md = 10−2 M⊙, and T0 = 4000 K.
Current usage metrics show cumulative count of Article Views (full-text article views including HTML views, PDF and ePub downloads, according to the available data) and Abstracts Views on Vision4Press platform.
Data correspond to usage on the plateform after 2015. The current usage metrics is available 48-96 hours after online publication and is updated daily on week days.
Initial download of the metrics may take a while.