Free Access
Fig. 5.
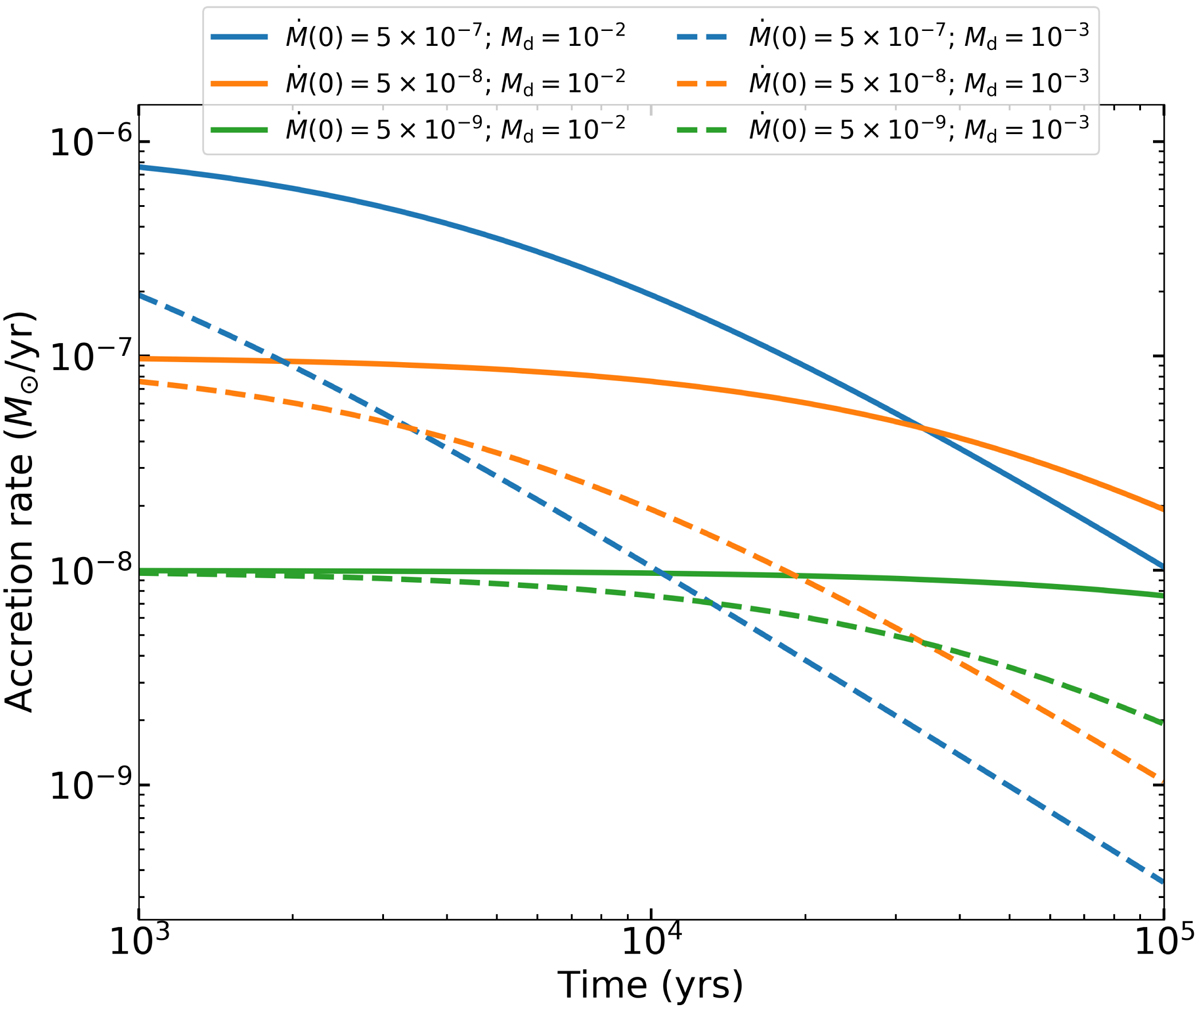
Evolution of accretion rates over time from the accretion model of Eq. (5). Colours denote different initial accretion rates Ṁ(0) in units of M⊙ yr−1, while different linestyles represent different initial disc masses Md in units of M⊙. Models with lower disc masses decrease faster over time.
Current usage metrics show cumulative count of Article Views (full-text article views including HTML views, PDF and ePub downloads, according to the available data) and Abstracts Views on Vision4Press platform.
Data correspond to usage on the plateform after 2015. The current usage metrics is available 48-96 hours after online publication and is updated daily on week days.
Initial download of the metrics may take a while.