Fig. 15.
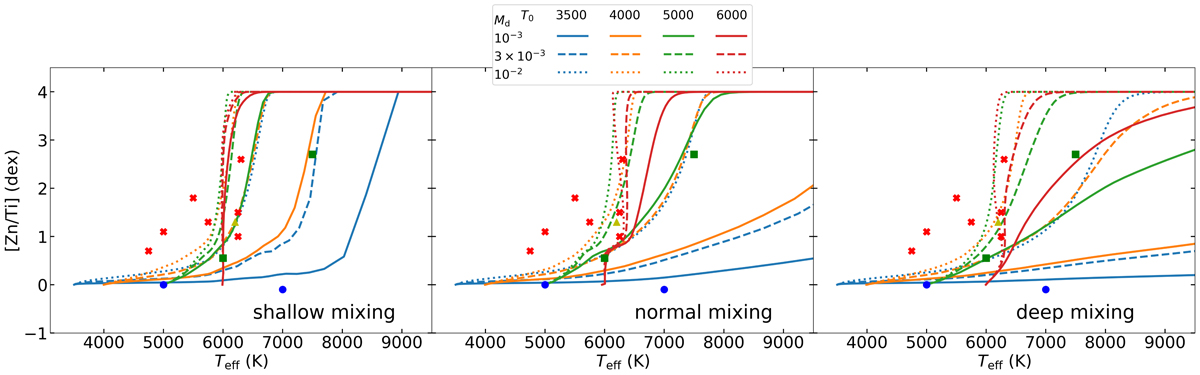
Comparison of 0.55-M⊙ models with 1.5 × 10⁻⁷ M⊙ yr−1 initial accretion rate for different assumptions on the depth of mixing. Left panel: models where accreted gas is only mixed with the outermost convective zone. Middle panel: mixing down to the He II convective zone. Right panel: mixing down to the deep convective regions (at T ∼ 200 000 K).
Current usage metrics show cumulative count of Article Views (full-text article views including HTML views, PDF and ePub downloads, according to the available data) and Abstracts Views on Vision4Press platform.
Data correspond to usage on the plateform after 2015. The current usage metrics is available 48-96 hours after online publication and is updated daily on week days.
Initial download of the metrics may take a while.