Fig. 11.
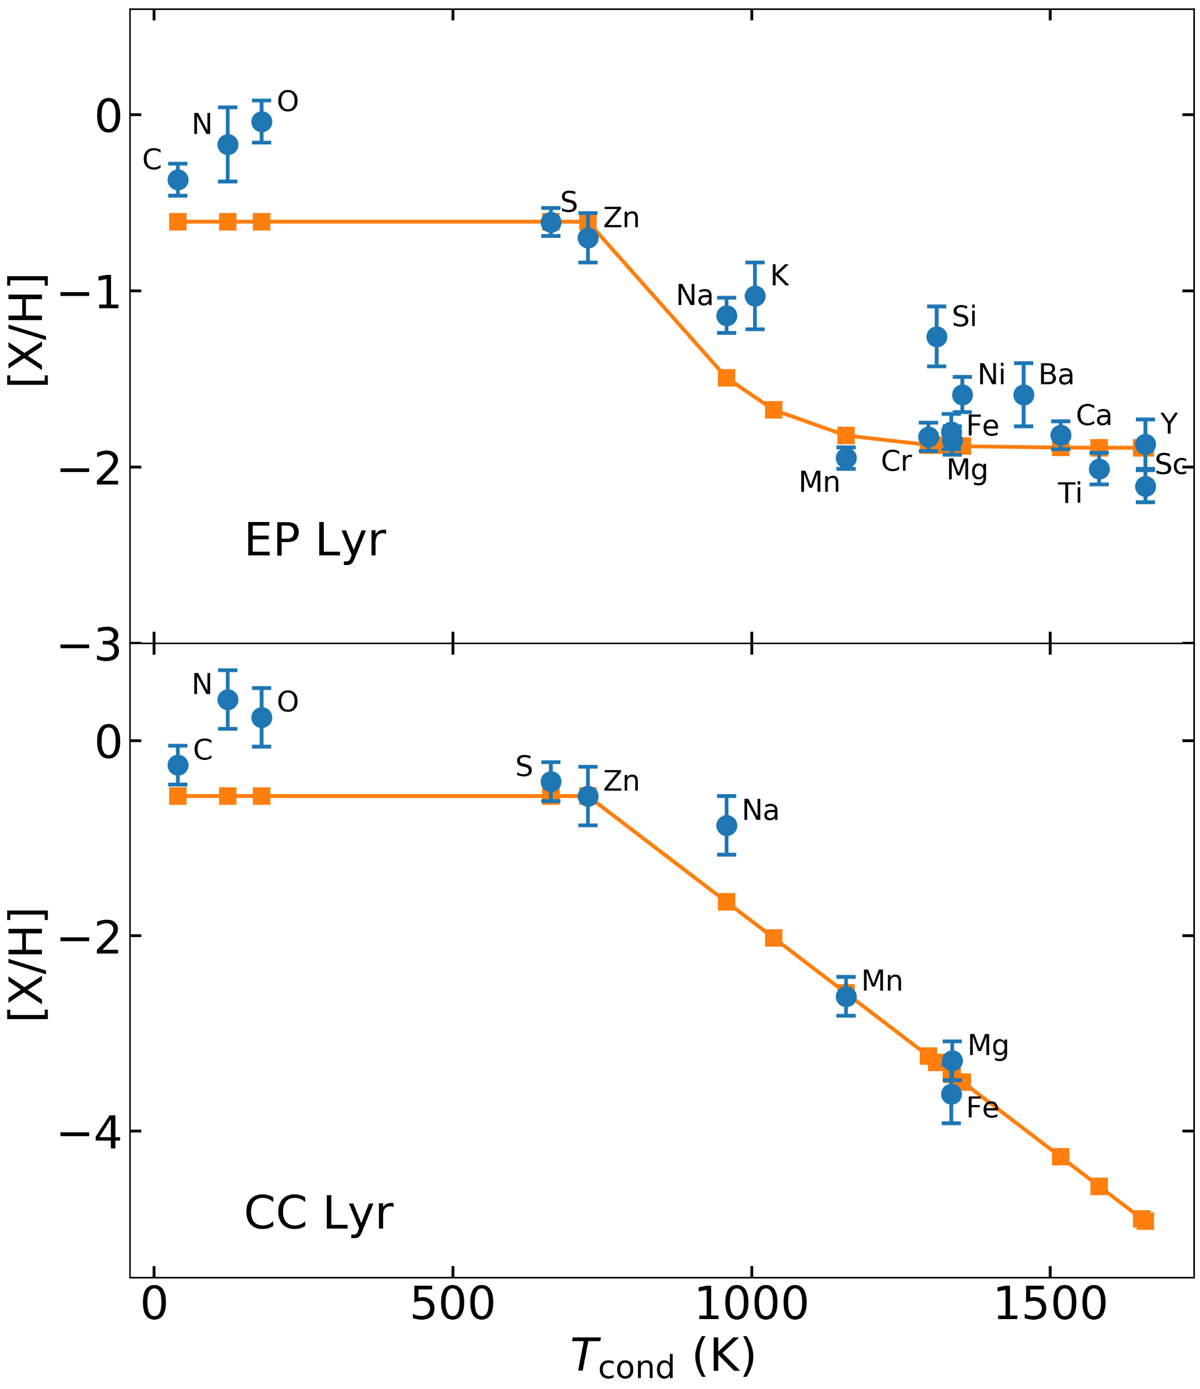
Comparison between the observed depletion pattern and the best-fitting model for a plateau-type profile (top, EP Lyr) and a saturated-type profile (bottom, CC Lyr). Observed abundances of elements are given as blue circles, while abundances from the accretion model are represented by orange squares. The elements used in the model correspond to those of Figs. 2 and 3. The model used in the top panel is a 0.55 M⊙ post-AGB star starting accretion at 5000 K with ![]() M⊙ yr−1 and Md = 10−3 M⊙ (Fig. 9, green solid line in bottom panel), taken at 6200 K. Bottom panel: the model is a 0.40 M⊙ post-RGB star starting accretion at 4000 K with Ṁ(0) = 5 × 10⁻⁸ M⊙ yr−1 and Md = 10−2 M⊙ (Fig. 8, orange dotted line in bottom panel), taken at 6250 K. The initial metallicity of the models is normalised to the observed S and Zn abundances of both stars.
M⊙ yr−1 and Md = 10−3 M⊙ (Fig. 9, green solid line in bottom panel), taken at 6200 K. Bottom panel: the model is a 0.40 M⊙ post-RGB star starting accretion at 4000 K with Ṁ(0) = 5 × 10⁻⁸ M⊙ yr−1 and Md = 10−2 M⊙ (Fig. 8, orange dotted line in bottom panel), taken at 6250 K. The initial metallicity of the models is normalised to the observed S and Zn abundances of both stars.
Current usage metrics show cumulative count of Article Views (full-text article views including HTML views, PDF and ePub downloads, according to the available data) and Abstracts Views on Vision4Press platform.
Data correspond to usage on the plateform after 2015. The current usage metrics is available 48-96 hours after online publication and is updated daily on week days.
Initial download of the metrics may take a while.