Open Access
Fig. 2.
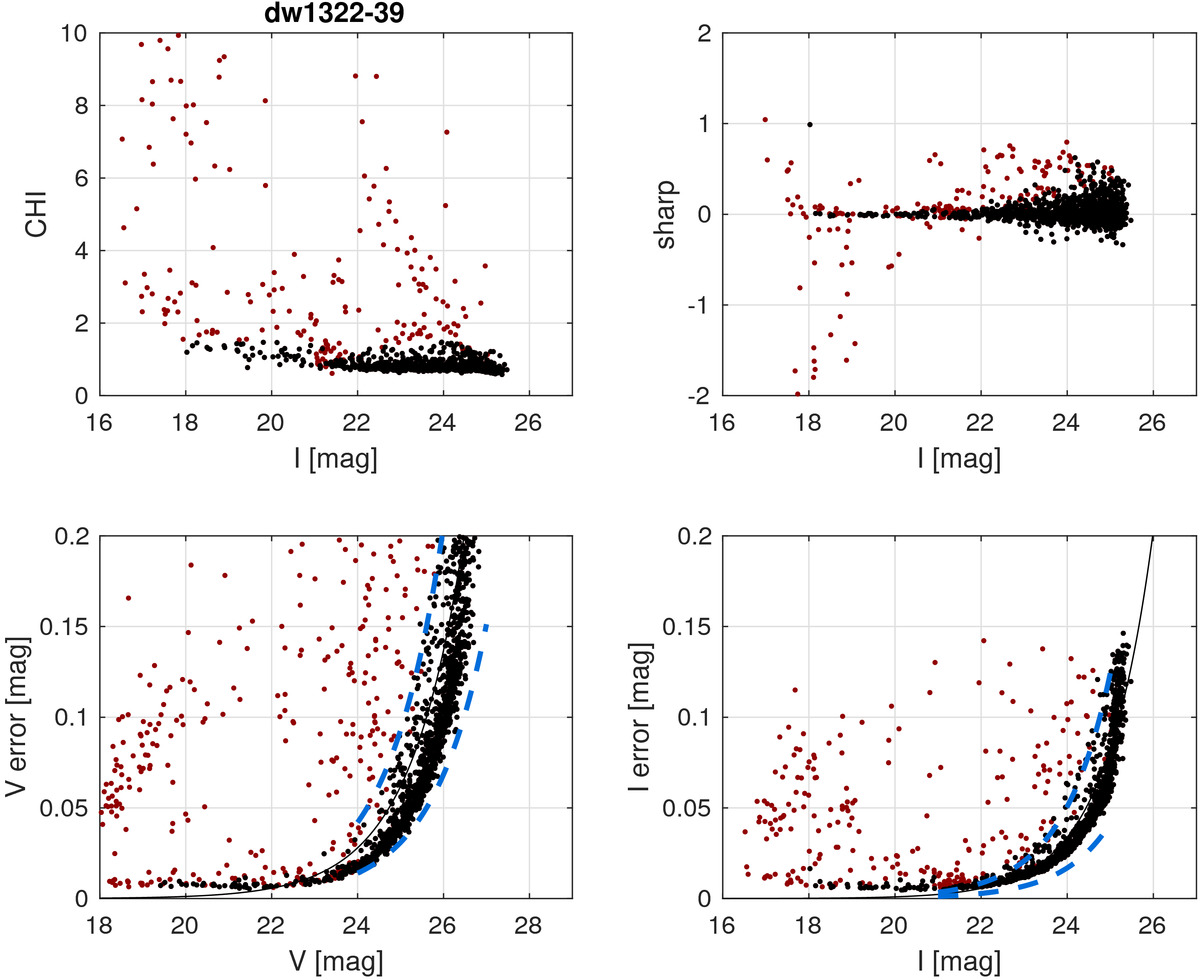
Quality cuts on photometric catalog of dw1322-39. The black dots correspond to stars fulfilling the constraints, while the red dots show rejected objects; blue dashed lines in the bottom plots of magnitude vs. error indicate 50% deviation from the best fitting value (black line) at the given magnitude.
Current usage metrics show cumulative count of Article Views (full-text article views including HTML views, PDF and ePub downloads, according to the available data) and Abstracts Views on Vision4Press platform.
Data correspond to usage on the plateform after 2015. The current usage metrics is available 48-96 hours after online publication and is updated daily on week days.
Initial download of the metrics may take a while.