Fig. 12.
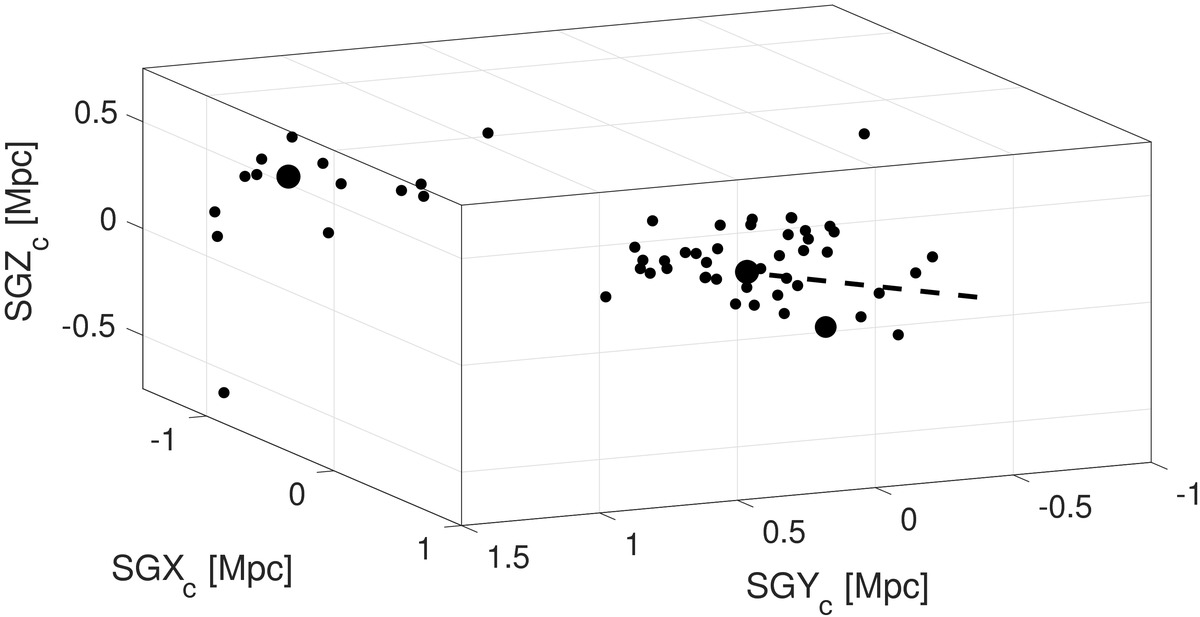
3D distribution of galaxies in Centaurus association, using supergalactic coordinates centered on Cen A. Two subgroups centered around M 83 (large dot on the left) and Cen A (large dot on the right) are clearly visible. In the Cen A subgroup, NGC 4945 is also indicated with a large dot. The dotted line indicates our line-of-sight toward Cen A, originating from the SGYcSGZc plane. The literature distance values are taken from Tully et al. (2015), Müller et al. (2018b), and Crnojević et al. (2019).
Current usage metrics show cumulative count of Article Views (full-text article views including HTML views, PDF and ePub downloads, according to the available data) and Abstracts Views on Vision4Press platform.
Data correspond to usage on the plateform after 2015. The current usage metrics is available 48-96 hours after online publication and is updated daily on week days.
Initial download of the metrics may take a while.