Fig. 11.
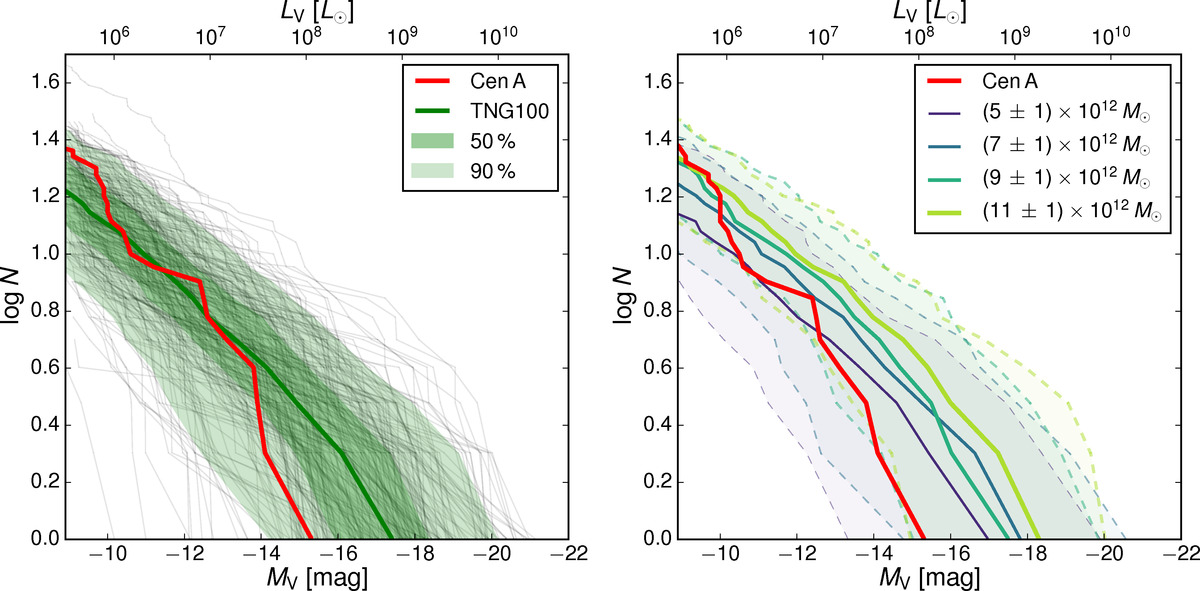
Comparison between the observed and the simulated luminosity functions. Left panel: luminosity function of Cen A within 200 kpc (red line) compared to the Illustris TNG100-1 simulation. The gray lines correspond to individual simulated Cen A analogs, the green line to the median, and the green shaded areas to the 90% and 50% intervals. Right panel: same as the left panel, but now the simulated systems are binned based on their host halo mass M200, with solid lines indicating their mean relation and dashed lines their 90% intervals.
Current usage metrics show cumulative count of Article Views (full-text article views including HTML views, PDF and ePub downloads, according to the available data) and Abstracts Views on Vision4Press platform.
Data correspond to usage on the plateform after 2015. The current usage metrics is available 48-96 hours after online publication and is updated daily on week days.
Initial download of the metrics may take a while.