Fig. 9
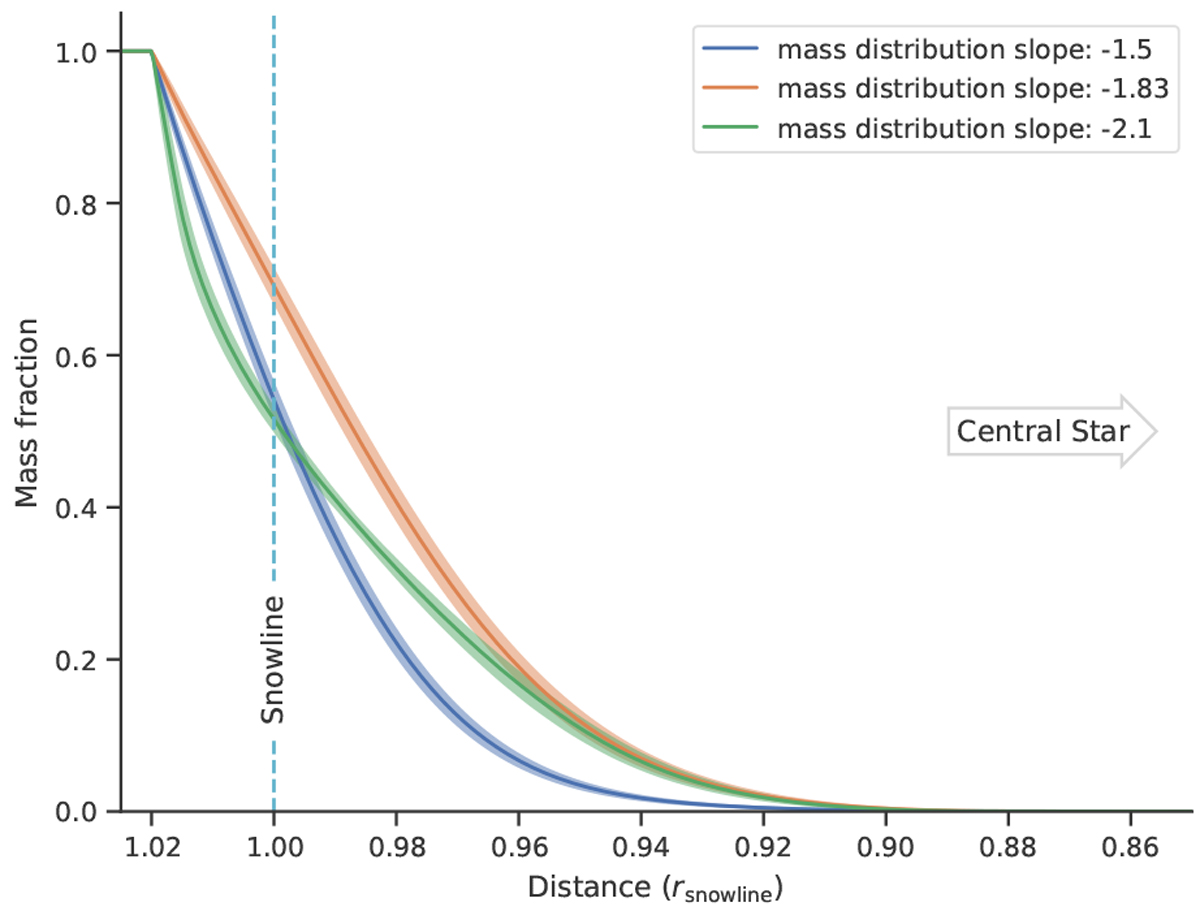
Remaining mass fraction in the overall population of bodies crossing the snowline (1 kg ≤ m ≤ 1 × 10⁹ kg) with shaded bands indicating the standard deviation due to the evolving disk. The mass shown is an integral over a distribution of masses with the indicated power-law slope and a mean over time in the disk. More details can be found at the end of Sect. 3.3.1.
Current usage metrics show cumulative count of Article Views (full-text article views including HTML views, PDF and ePub downloads, according to the available data) and Abstracts Views on Vision4Press platform.
Data correspond to usage on the plateform after 2015. The current usage metrics is available 48-96 hours after online publication and is updated daily on week days.
Initial download of the metrics may take a while.