Fig. 8
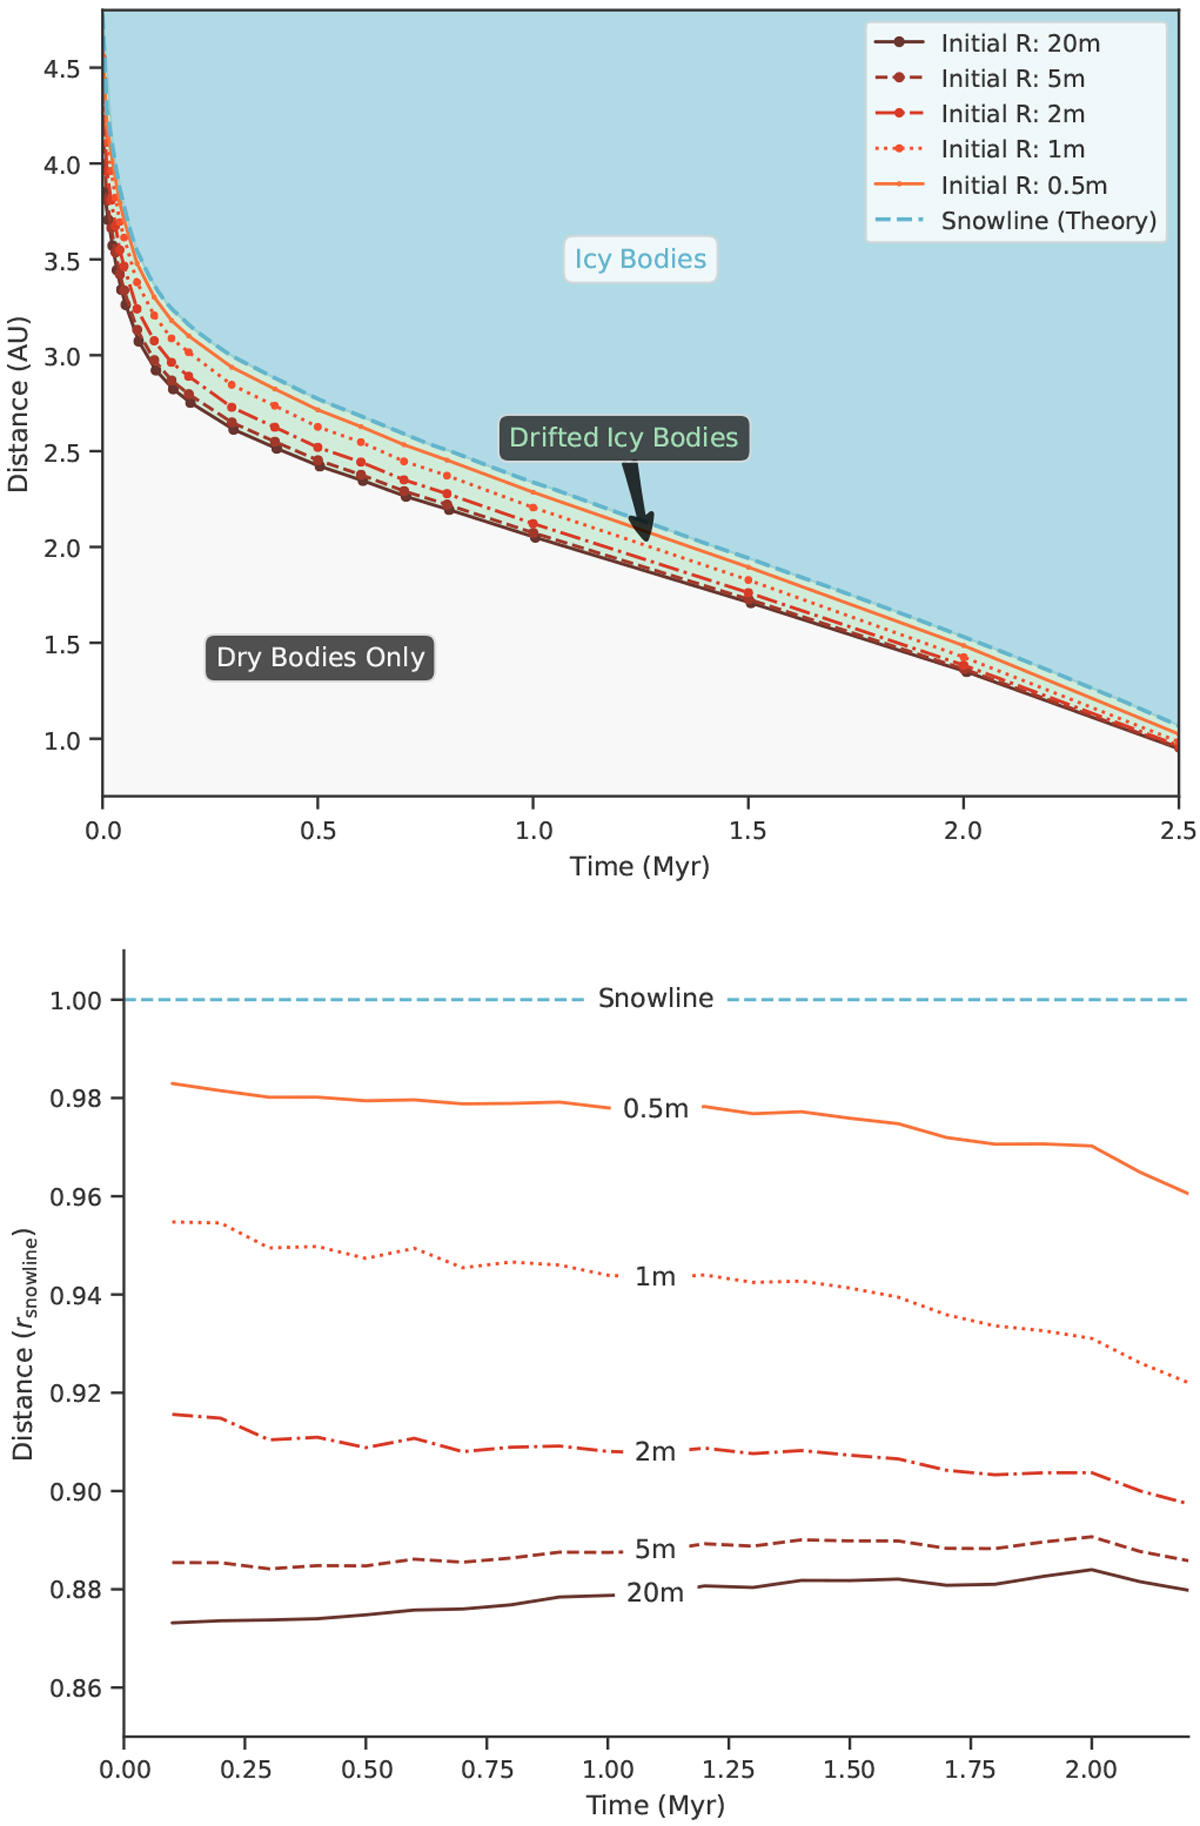
Comparison of locations of complete disintegration of different sized bodies without a dust mantle. In the top panel, the distance to the star is measured in AU and the dots represent the locations where the body shrank to a size of 10 cm. The dashed, cyan line indicates the evolving position of the P–T tabulated snowline, and the regions where only icy solid bodies, only water depleted solid bodies, and the region that is injected with drifting icy bodies are colored and labeled. In the bottom panel, the same data is shown but measured in units of the evolving, tabulated snowline position (1 corresponds to the snowline position, 0 to the central star).
Current usage metrics show cumulative count of Article Views (full-text article views including HTML views, PDF and ePub downloads, according to the available data) and Abstracts Views on Vision4Press platform.
Data correspond to usage on the plateform after 2015. The current usage metrics is available 48-96 hours after online publication and is updated daily on week days.
Initial download of the metrics may take a while.