Fig. 4
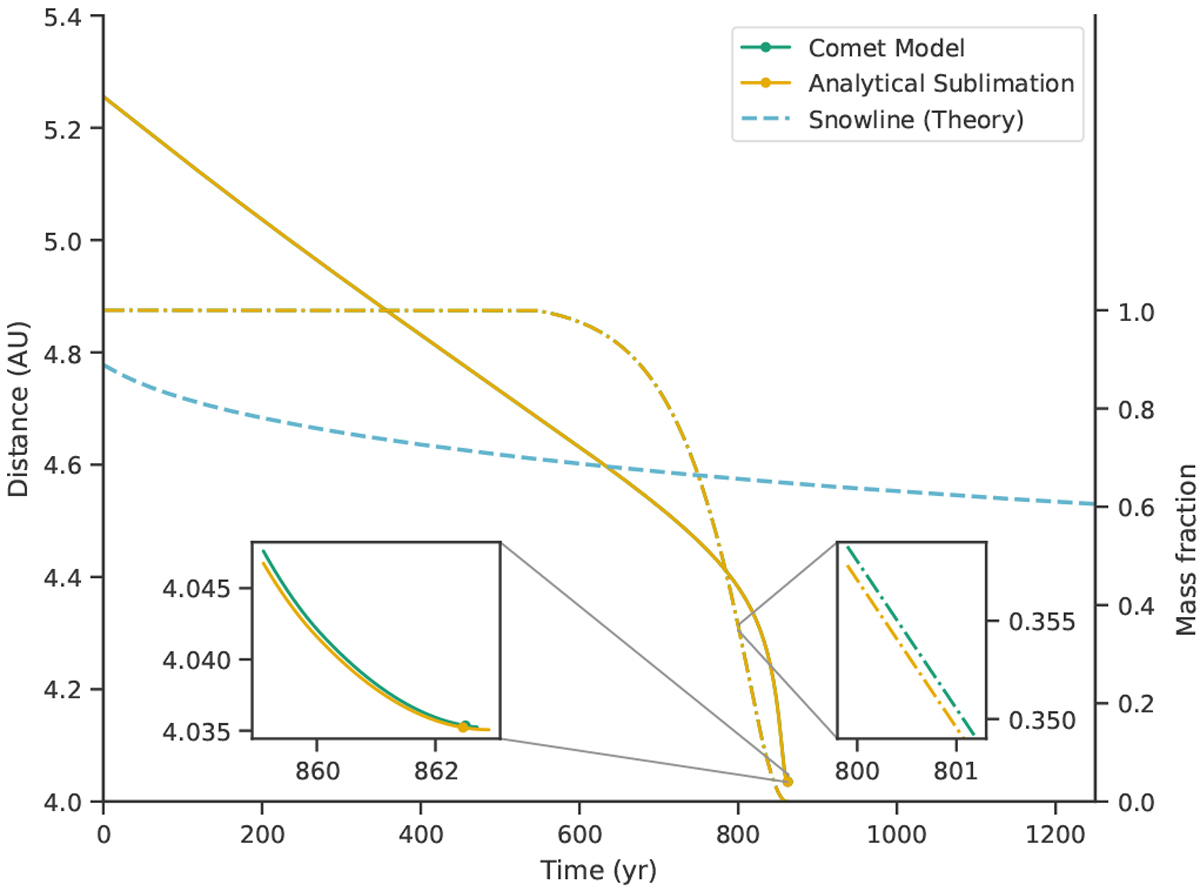
Comparison of the comet model solving the internal structure and the analytical solution (Eq. (12)) for ten-meter-sized bodies. The solid lines show the distance to the star (left axis) with dots representing the locations where the bodies shrank to a size of 10 cm while the dash-dotted lines show the remaining mass fraction (right axis). The lines of the two different model solutions are essentially indistinguishable. The initial position is 10% above the snowline location at time zero in the nominal disk. The barely visible kink in the mass fractions at 600 yr is due to reaching the threshold temperature of 150 K, where the sublimation models are started.
Current usage metrics show cumulative count of Article Views (full-text article views including HTML views, PDF and ePub downloads, according to the available data) and Abstracts Views on Vision4Press platform.
Data correspond to usage on the plateform after 2015. The current usage metrics is available 48-96 hours after online publication and is updated daily on week days.
Initial download of the metrics may take a while.