Free Access
Fig. 3
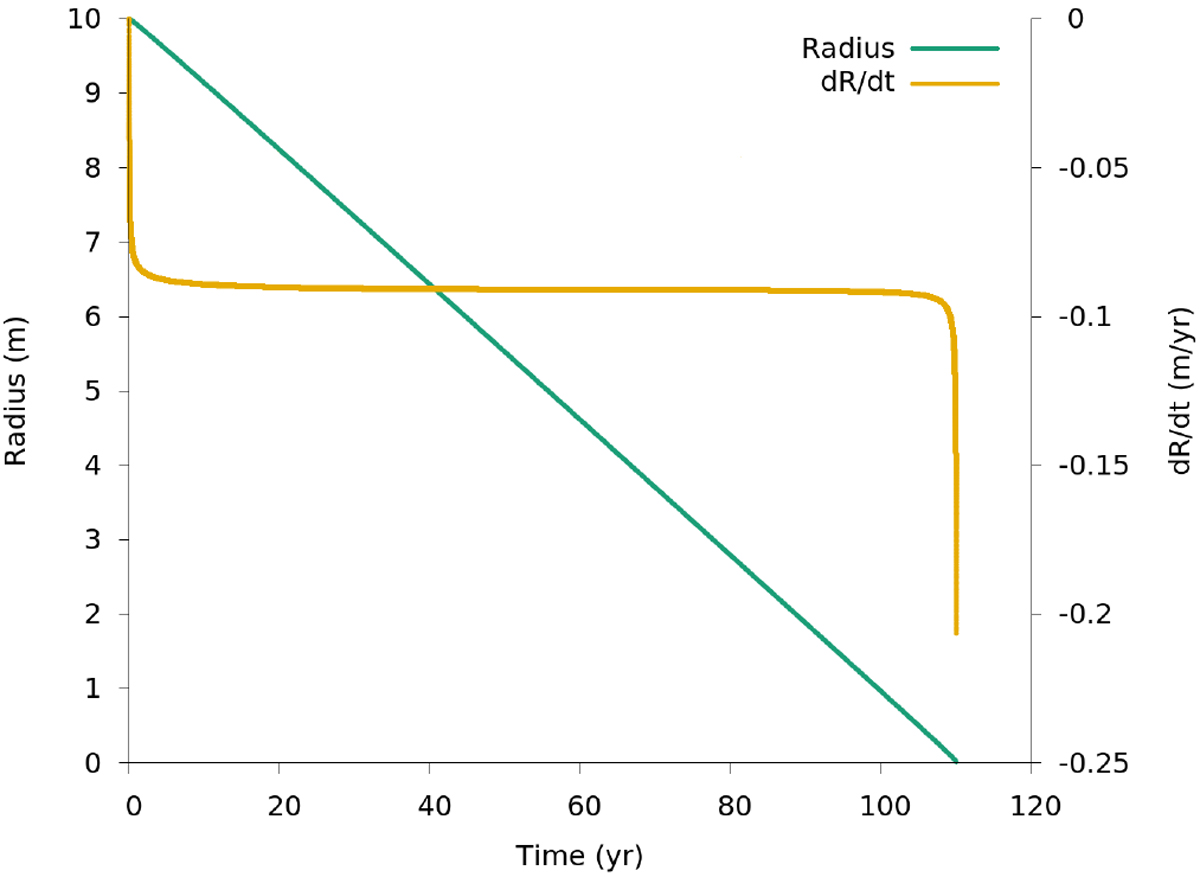
Almost linear decrease in radius over time (green line, left axis) for a fixed surface temperature of 169 K using the cometary nucleus model. The derivative d R∕d t is plotted inorange (right axis).
Current usage metrics show cumulative count of Article Views (full-text article views including HTML views, PDF and ePub downloads, according to the available data) and Abstracts Views on Vision4Press platform.
Data correspond to usage on the plateform after 2015. The current usage metrics is available 48-96 hours after online publication and is updated daily on week days.
Initial download of the metrics may take a while.