Fig. 14
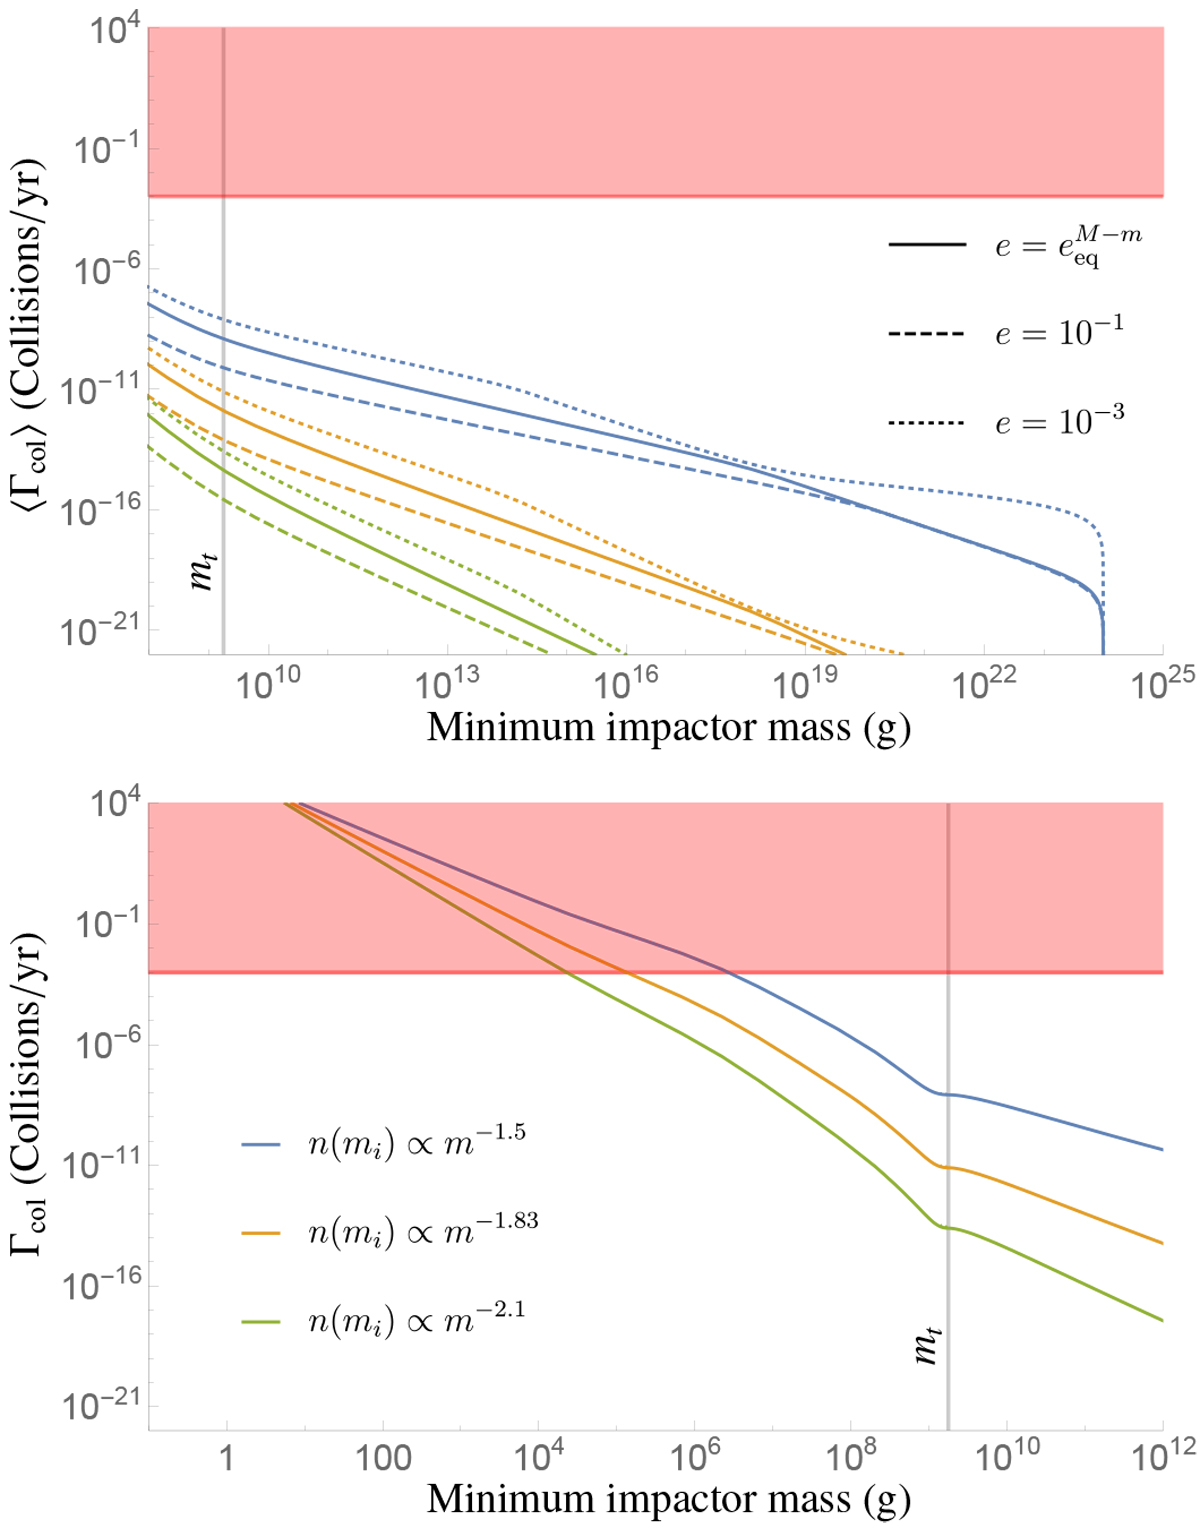
Collision rates of the nominal target body (Table 2) with a radius of 10 m integrated over impactor masses larger than the indicated minimum mass. Top panel: orbital collision rate and bottom panel: stokes collision rate. Results are shown for three different slopes of the impactor mass distribution and in the bottom panel additionally for three different eccentricity and inclination values.
![]() is the equilibrium eccentricity in the vicinity of a mars mass perturber (Ida 1990; Thommes et al. 2003). The red shaded region depicts collisions more frequent than once every thousand years and the target mass
mt is indicated.
is the equilibrium eccentricity in the vicinity of a mars mass perturber (Ida 1990; Thommes et al. 2003). The red shaded region depicts collisions more frequent than once every thousand years and the target mass
mt is indicated.
Current usage metrics show cumulative count of Article Views (full-text article views including HTML views, PDF and ePub downloads, according to the available data) and Abstracts Views on Vision4Press platform.
Data correspond to usage on the plateform after 2015. The current usage metrics is available 48-96 hours after online publication and is updated daily on week days.
Initial download of the metrics may take a while.