Fig. 11
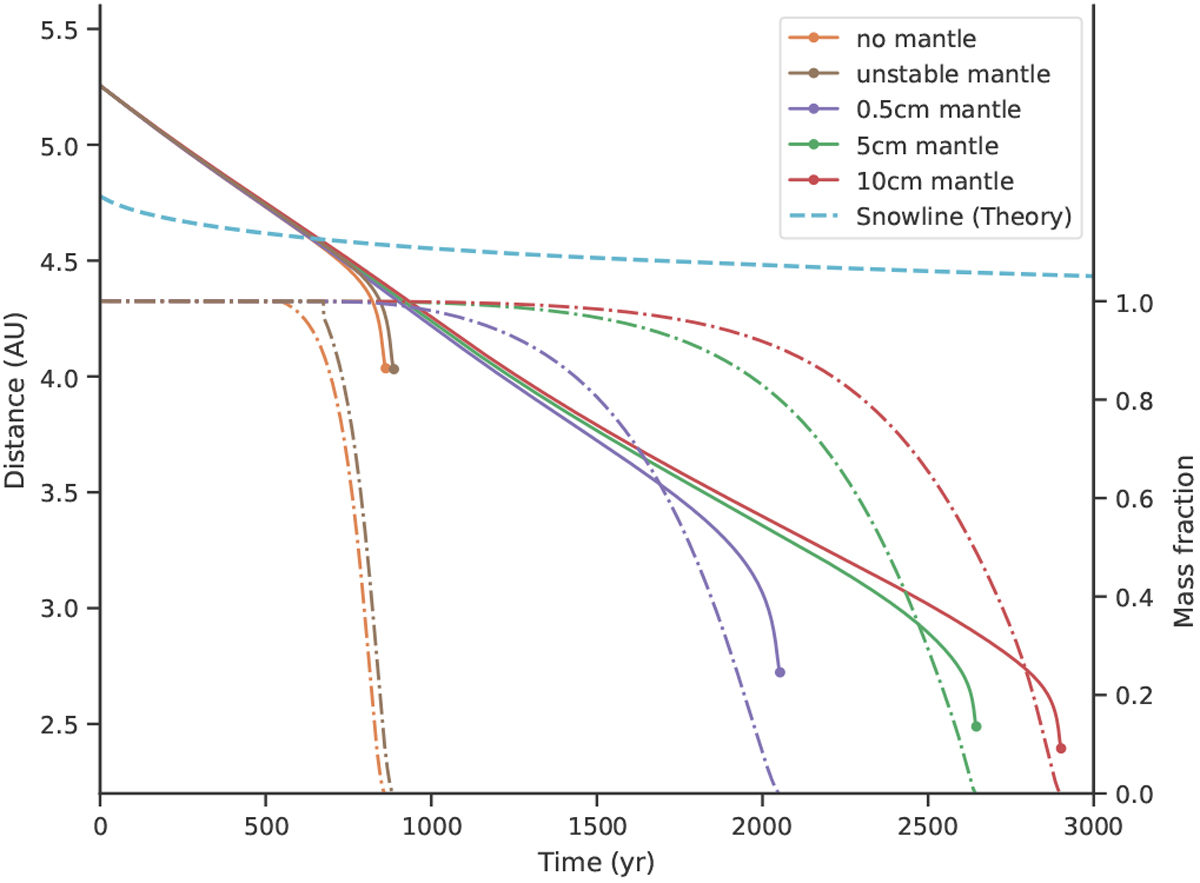
Sublimation comparison of a ten-meter-sized bodies with different dust mantle thicknesses and removal processes. The legend is ordered in increasing sublimation time. The smooth line marks the location of the body in time (left axis), while the dots at the end of the line indicate shrinking to a radius of 10 cm as in Figs. 8 and 12. The dash-dotted lines indicate the mass fraction compared to the initial mass of the same colored case (right axis). The kink that is visible in the mass fraction of the unstable (initially 5 cm thick) mantle stems from the mantle breaking up at that point in time.
Current usage metrics show cumulative count of Article Views (full-text article views including HTML views, PDF and ePub downloads, according to the available data) and Abstracts Views on Vision4Press platform.
Data correspond to usage on the plateform after 2015. The current usage metrics is available 48-96 hours after online publication and is updated daily on week days.
Initial download of the metrics may take a while.