Fig. 4.
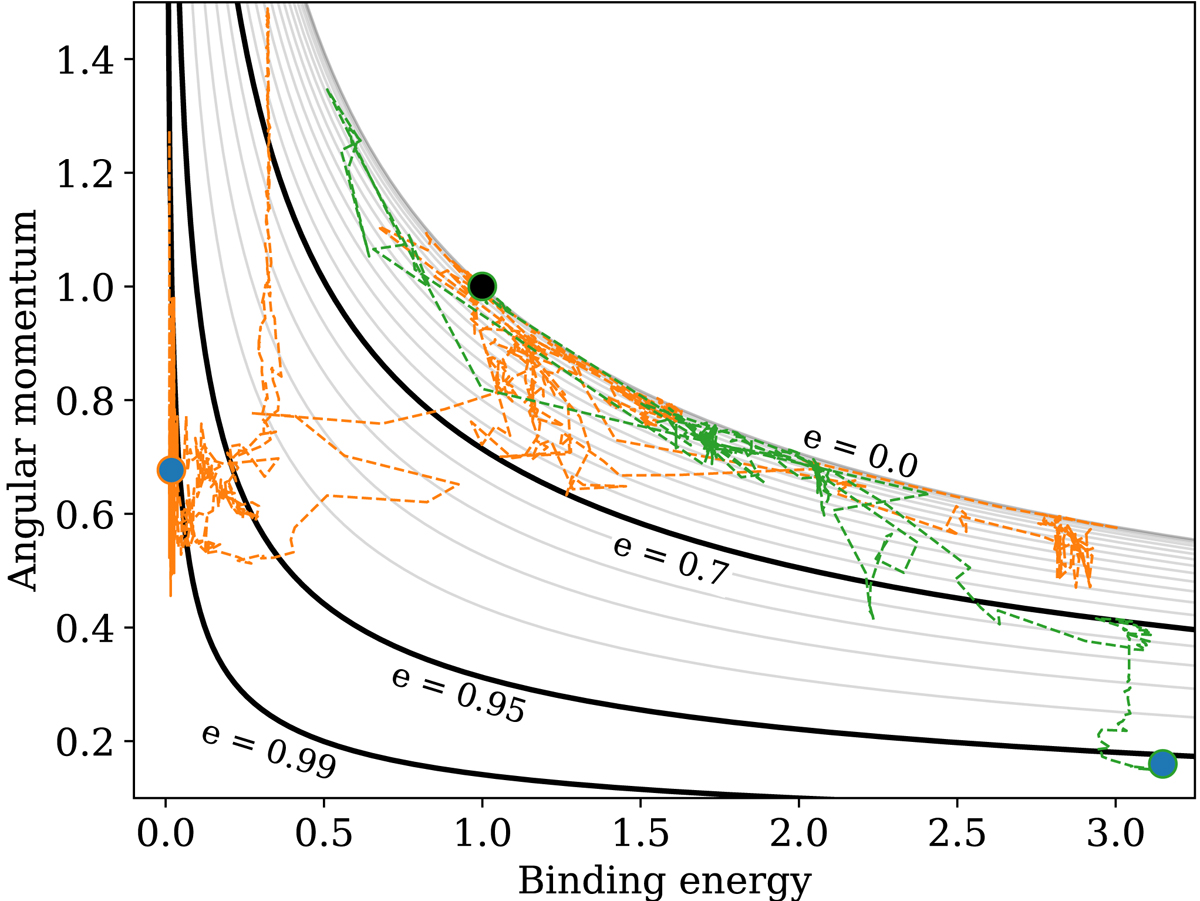
Evolution of the binding energy and angular momentum of two planets that reached e > 0.95. Values are normalised to the initial orbit of the planet (black dot). We also show constant-eccentricity curves spaced in intervals of Δe = 0.05, except we show e = 0.99 instead of e = 1. The orange trajectory follows a planet whose semimajor axis increased from 7.3 to 395 AU, while its angular momentum dropped by only 30%. The green trajectory is for a planet that in fact gained binding energy, but lost 84% of its angular momentum. For clarity, only the first 1 Myr is shown. The final eccentricities shown are 0.996 and 0.959, respectively.
Current usage metrics show cumulative count of Article Views (full-text article views including HTML views, PDF and ePub downloads, according to the available data) and Abstracts Views on Vision4Press platform.
Data correspond to usage on the plateform after 2015. The current usage metrics is available 48-96 hours after online publication and is updated daily on week days.
Initial download of the metrics may take a while.