Free Access
Fig. 7.
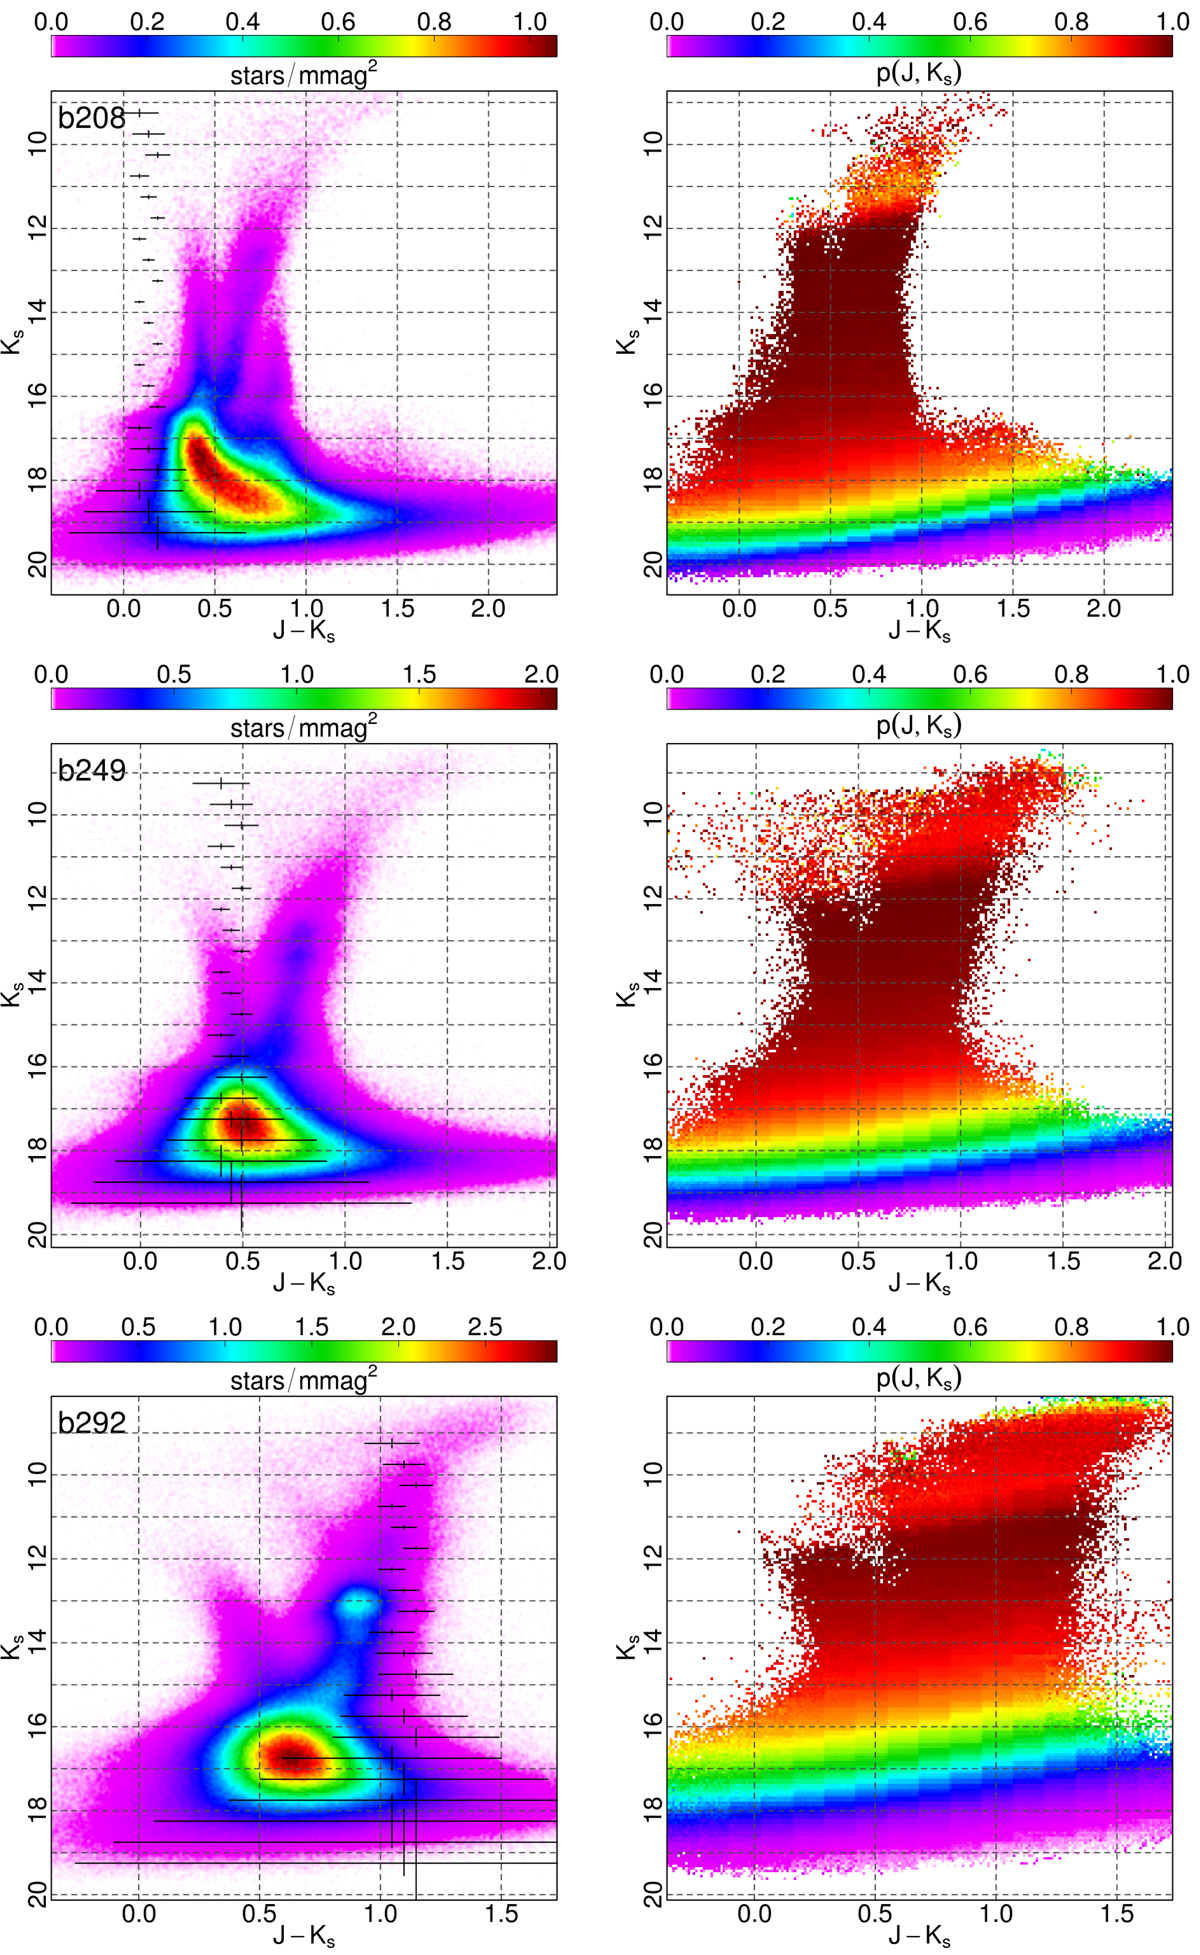
Hess diagram of the eight selected tiles with typical color and magnitude errors shown as crosses at their respective Ks reference level (left panel), and corresponding photometric completeness map, averaged for all detectors except 04 and 16 (right panels). The VVV name of the field is labeled in each plot.
Current usage metrics show cumulative count of Article Views (full-text article views including HTML views, PDF and ePub downloads, according to the available data) and Abstracts Views on Vision4Press platform.
Data correspond to usage on the plateform after 2015. The current usage metrics is available 48-96 hours after online publication and is updated daily on week days.
Initial download of the metrics may take a while.