Fig. 6.
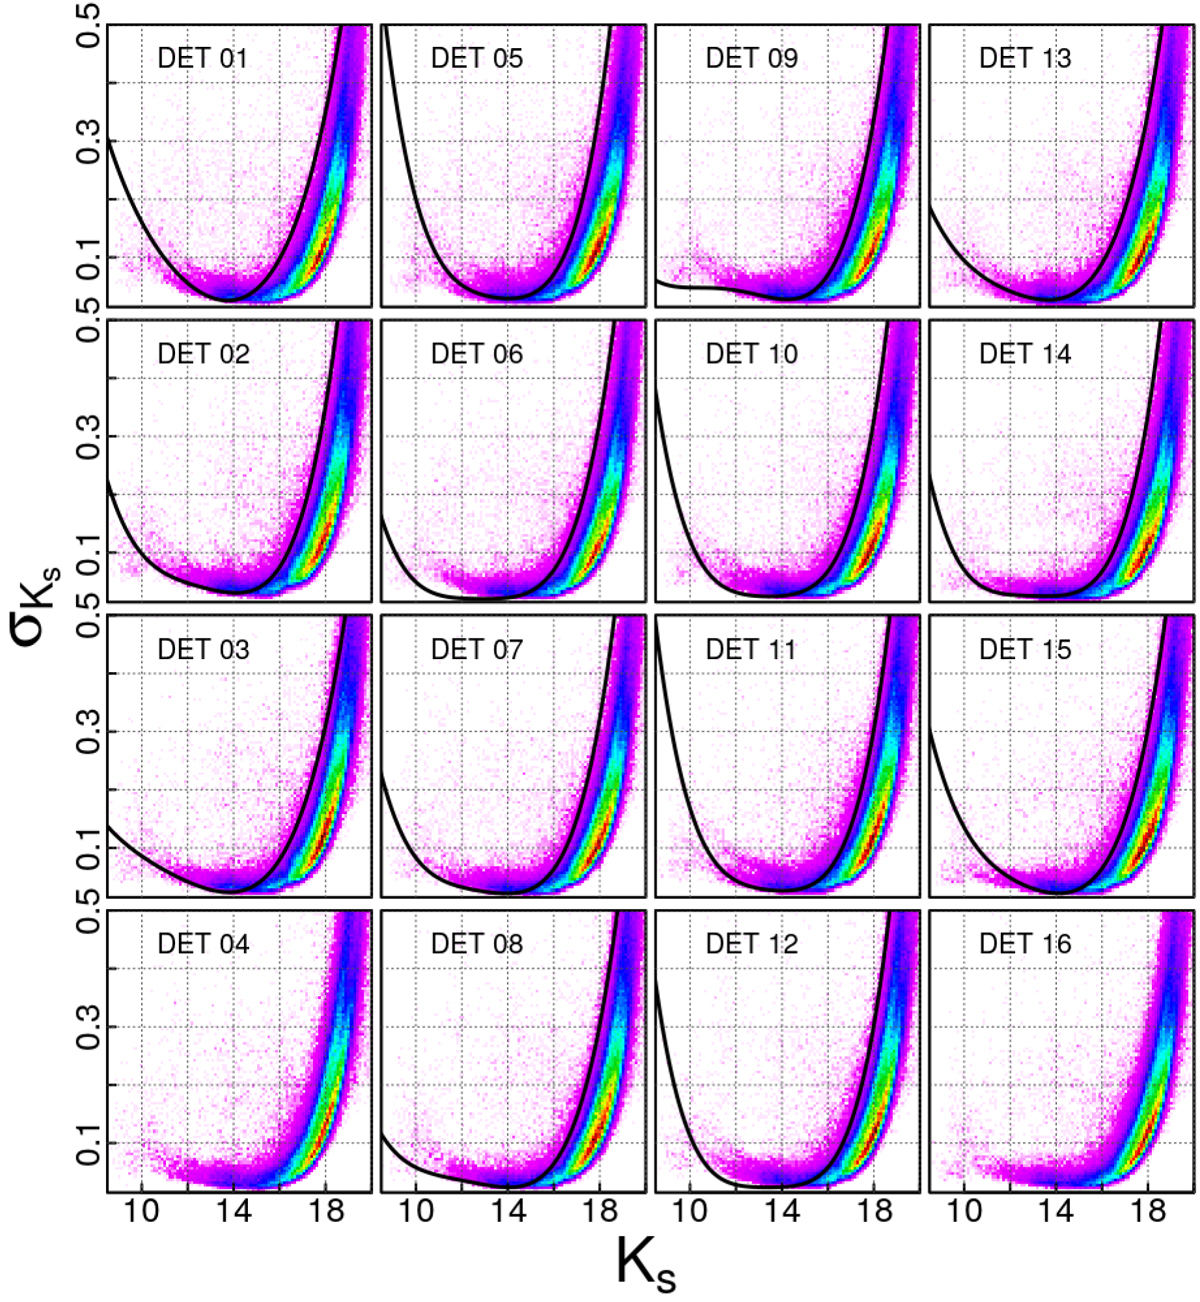
Photometric error profile for a sample field (b249). The 2D histogram in each panel displays the σKs vs. Ks distribution of detected stars within a given detector (labeled in each panel). The color-coding indicates the density in each 2D histogram, from low (magenta) to very high (dark red) relative densities. The split or broadened sequences are due to the error mitigation in overlapping areas of a side ensemble. Detections in overlapping areas have smaller uncertainty. The black solid line refers to the combined errors: ΔKs vs. Ks, as calculated from the completeness experiments (except for detectors 04 and 16, for which no completeness is available).
Current usage metrics show cumulative count of Article Views (full-text article views including HTML views, PDF and ePub downloads, according to the available data) and Abstracts Views on Vision4Press platform.
Data correspond to usage on the plateform after 2015. The current usage metrics is available 48-96 hours after online publication and is updated daily on week days.
Initial download of the metrics may take a while.