Fig. 5.
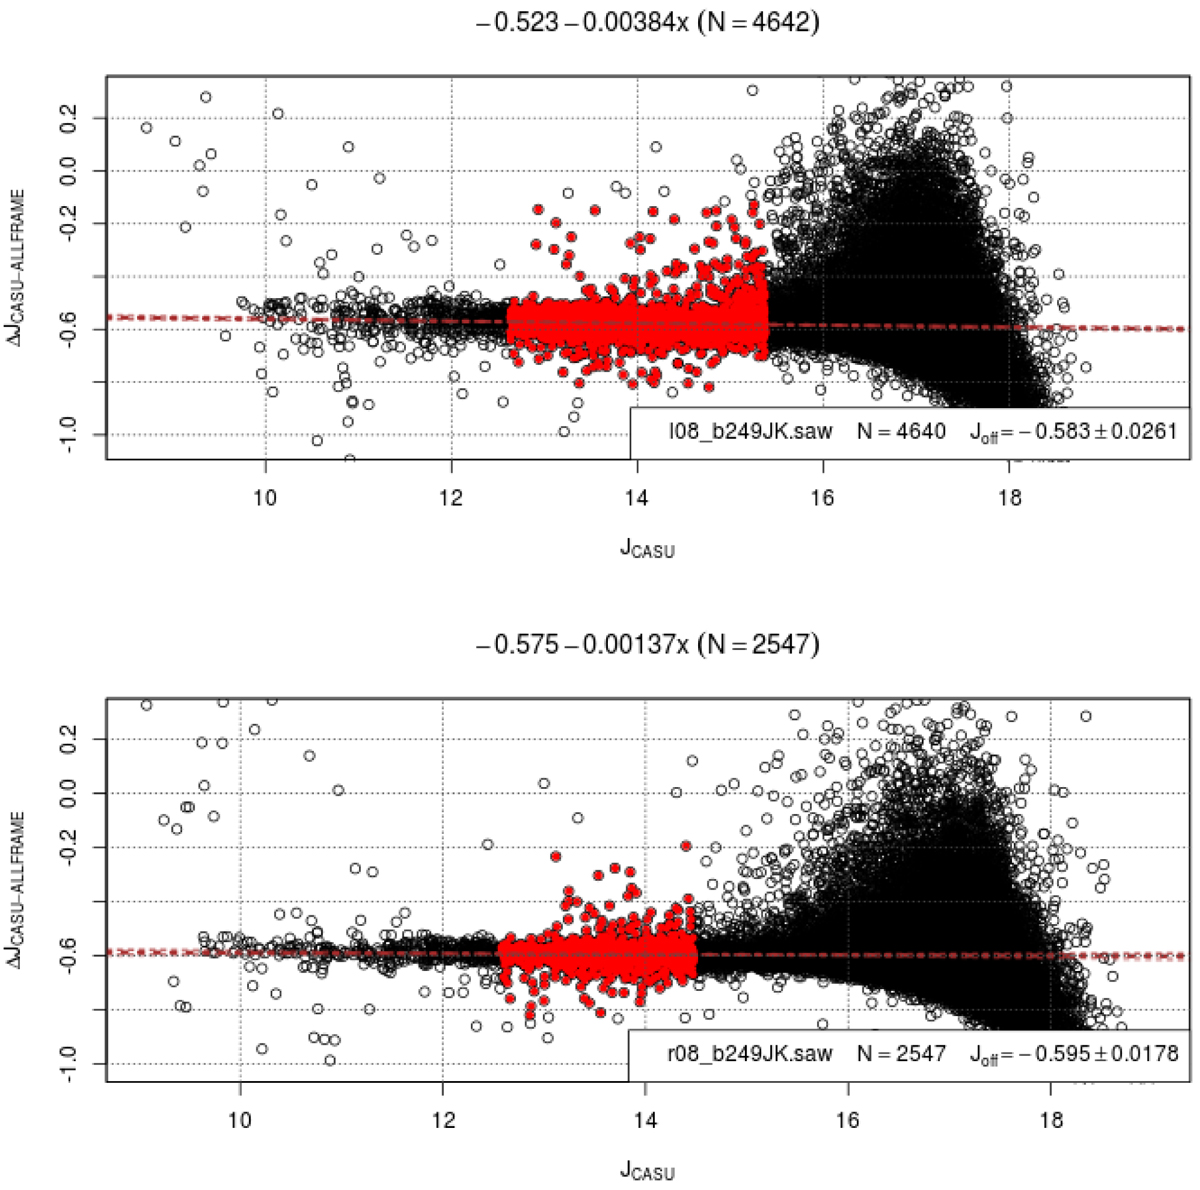
Example plot for the CASU-ALLFRAME calibration for detector 08 of tile b249. Top panel: refers to the left side, while the bottom panel to the right side. Shown is the magnitude difference in J between CASU and ALLFRAME catalogs vs. CASU reference. The black circles follow all the matches, while the red dots mark the selected magnitude range where the zero point is calculated. The title of each plot refers to the linear fit performed on the red dots, and to the number of stars from which it is derived. Also shown in the legend is the source catalog, the estimated zero point and the corresponding uncertainty. The criterion to select the red dots is dependent on a window from which we have the minimum spread in the Δm relation.
Current usage metrics show cumulative count of Article Views (full-text article views including HTML views, PDF and ePub downloads, according to the available data) and Abstracts Views on Vision4Press platform.
Data correspond to usage on the plateform after 2015. The current usage metrics is available 48-96 hours after online publication and is updated daily on week days.
Initial download of the metrics may take a while.