Fig. 3.
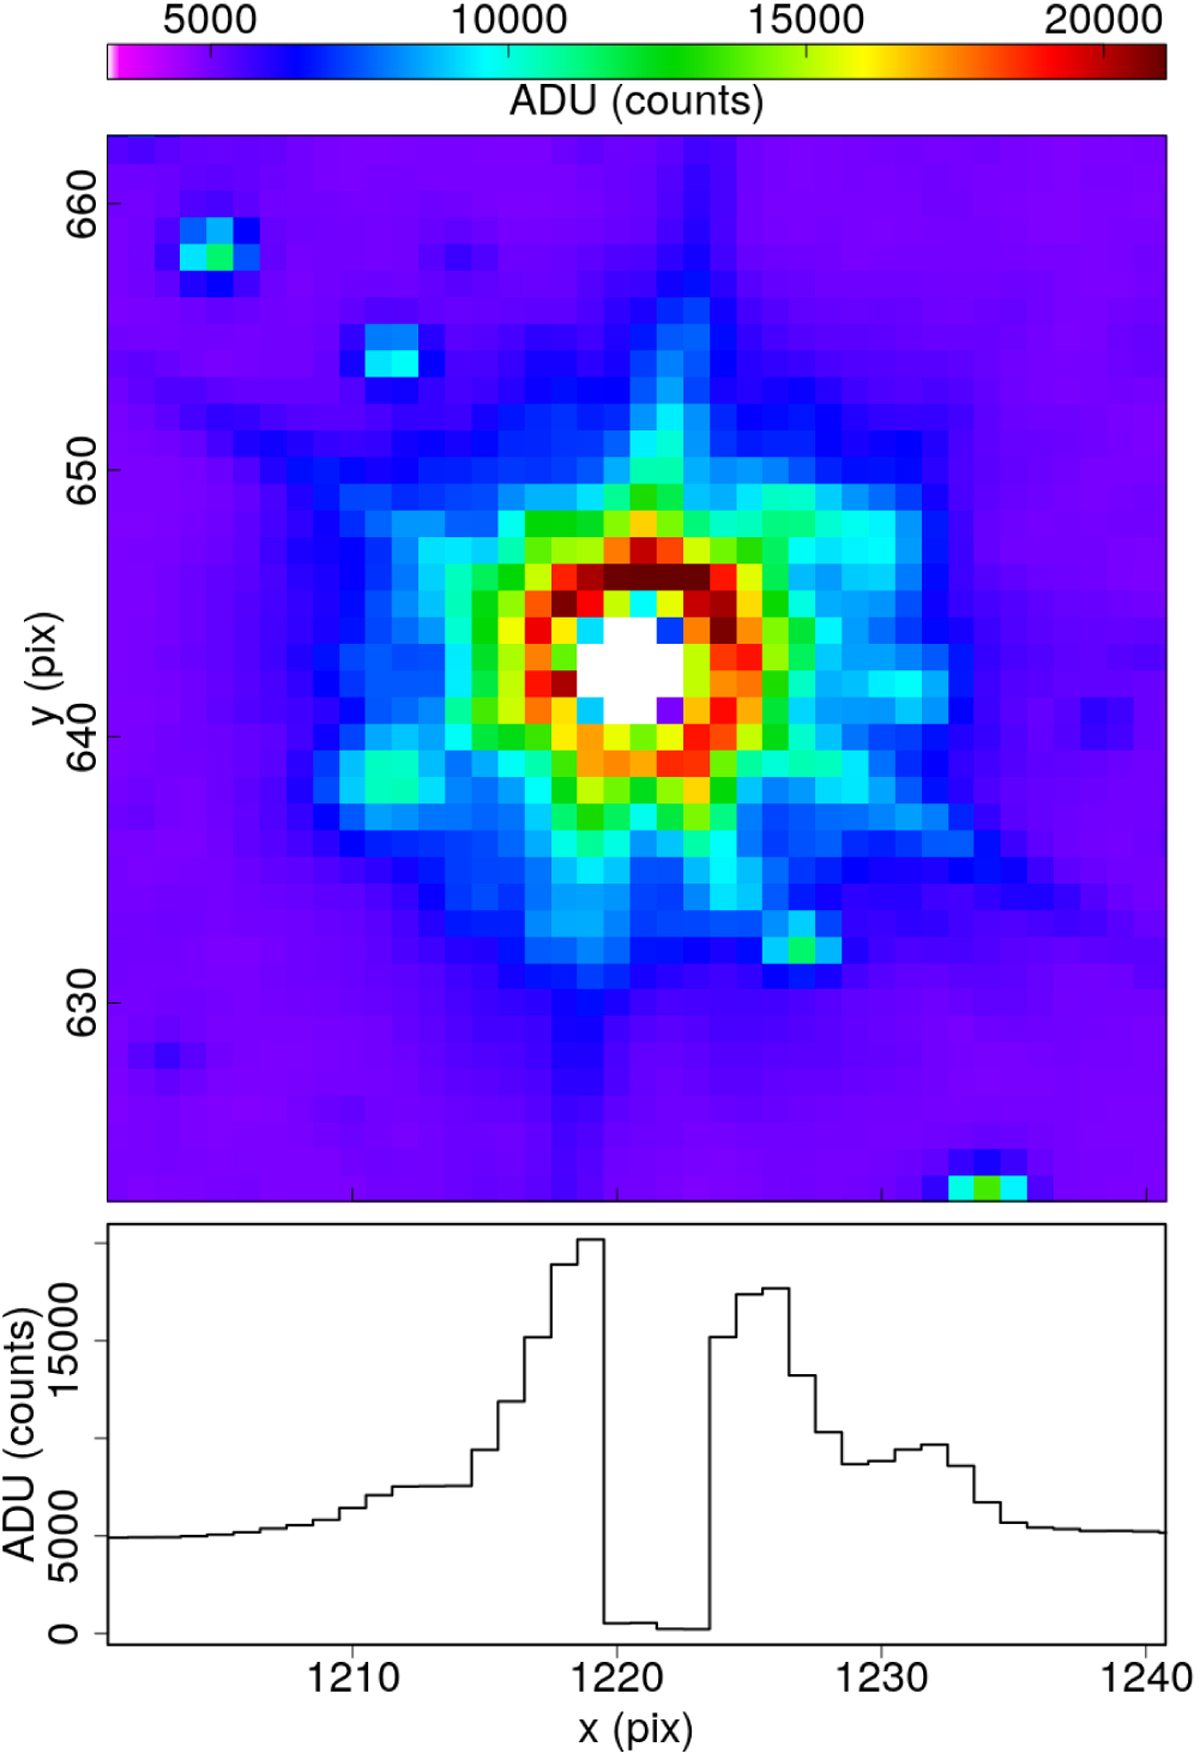
Zoom in to a saturated star in detector 05. Top panel: heatmap of the ADU counts, while the bottom panel is an horizontal cut through the center of the star. In cases like this very bright star the fault is evident and often leads to artifacts around it, but for stars moderately within the nonlinearity and saturation regimes, the central dip is much more subtle and cannot be filtered out simply.
Current usage metrics show cumulative count of Article Views (full-text article views including HTML views, PDF and ePub downloads, according to the available data) and Abstracts Views on Vision4Press platform.
Data correspond to usage on the plateform after 2015. The current usage metrics is available 48-96 hours after online publication and is updated daily on week days.
Initial download of the metrics may take a while.