Fig. 11.
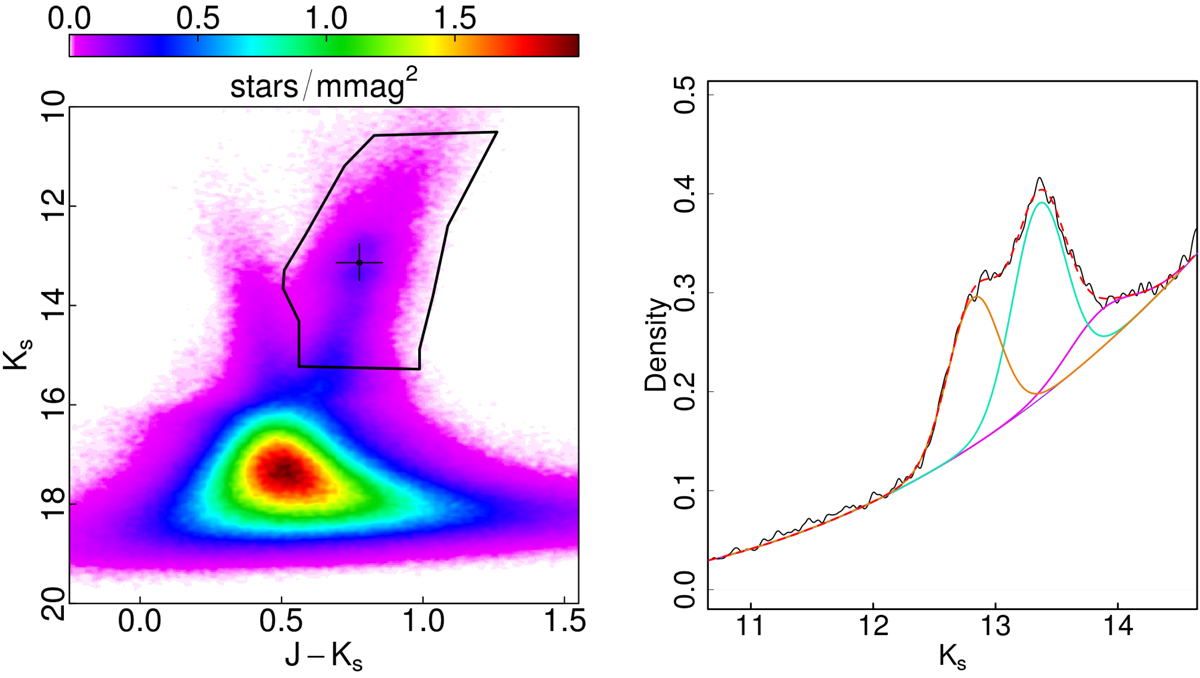
Example of the adopted procedure to trace the RC distribution in a typical field where the X-shape of the bulge is detected (see text). Left panel: observed Hess diagram of tile b249, with a black polygon acting as the selection window used to isolate RC and RGB stars, and to construct the corresponding luminosity function reported in the right panel. The black cross shows the final estimate of the mean RC position, together with its effective width in color and magnitude. Right panel: kernel estimate of the selected RC and RGB luminosity function, not corrected for completeness (black solid line). Also plotted are the fit to the RGB distribution (violet line), and three Gaussian components used to fit the RCs (apricot and cyan) and RGB-bump (magenta). The global fit using all components is shown as a dashed red line. In this example the mean and σ of the Gaussians component are Ks = 12.82 ± 0.21 mag and 13.36 ± 0.22 mag for the RC, and 13.86 ± 0.28 mag for the RGB bump. In this exercise, no reddening or completeness correction has been applied.
Current usage metrics show cumulative count of Article Views (full-text article views including HTML views, PDF and ePub downloads, according to the available data) and Abstracts Views on Vision4Press platform.
Data correspond to usage on the plateform after 2015. The current usage metrics is available 48-96 hours after online publication and is updated daily on week days.
Initial download of the metrics may take a while.