Fig. 1.
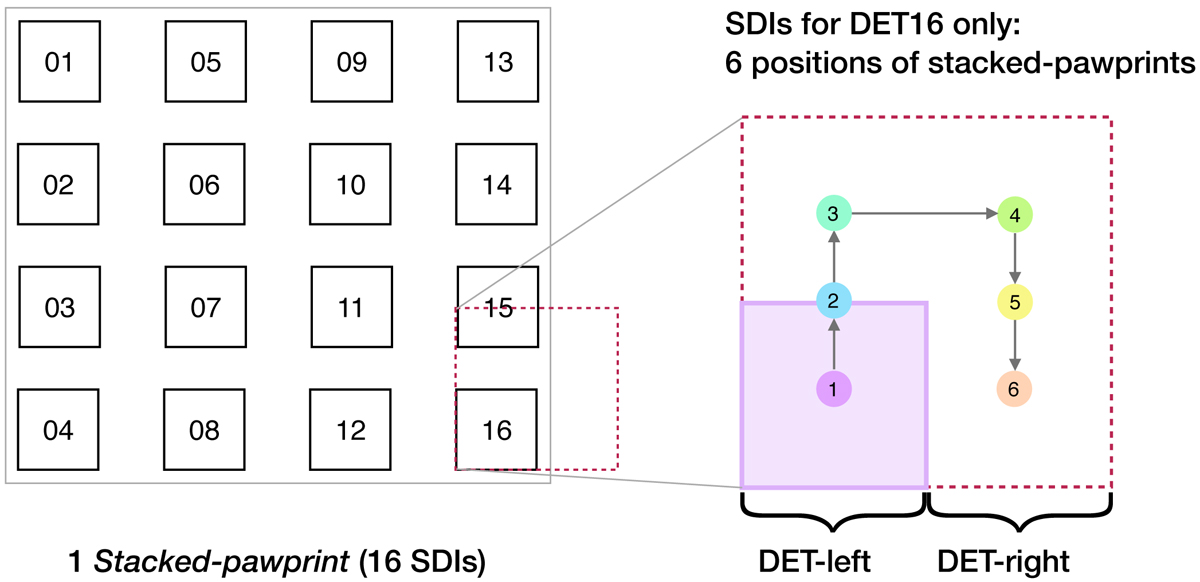
Left panel: representation of a stacked pawprint (black solid line). The numbers refer to the detector identifications, while the dashed red square defines the total area mapped by detector 16 (DET16) when the six stacked pawprints are merged together. Right panel: schematic pattern of DET16 SDI in the six stacked pawprints. Colors and numbers denote the order and position in which the six exposures are taken. The dotted red square refers to the total field of view covered by the mosaic of the six SDIs, while DET-left and DET-right define the total area mapped by positions 1 + 2 + 3 and 4 + 5 + 6, respectively.
Current usage metrics show cumulative count of Article Views (full-text article views including HTML views, PDF and ePub downloads, according to the available data) and Abstracts Views on Vision4Press platform.
Data correspond to usage on the plateform after 2015. The current usage metrics is available 48-96 hours after online publication and is updated daily on week days.
Initial download of the metrics may take a while.