Open Access
Fig. 7.
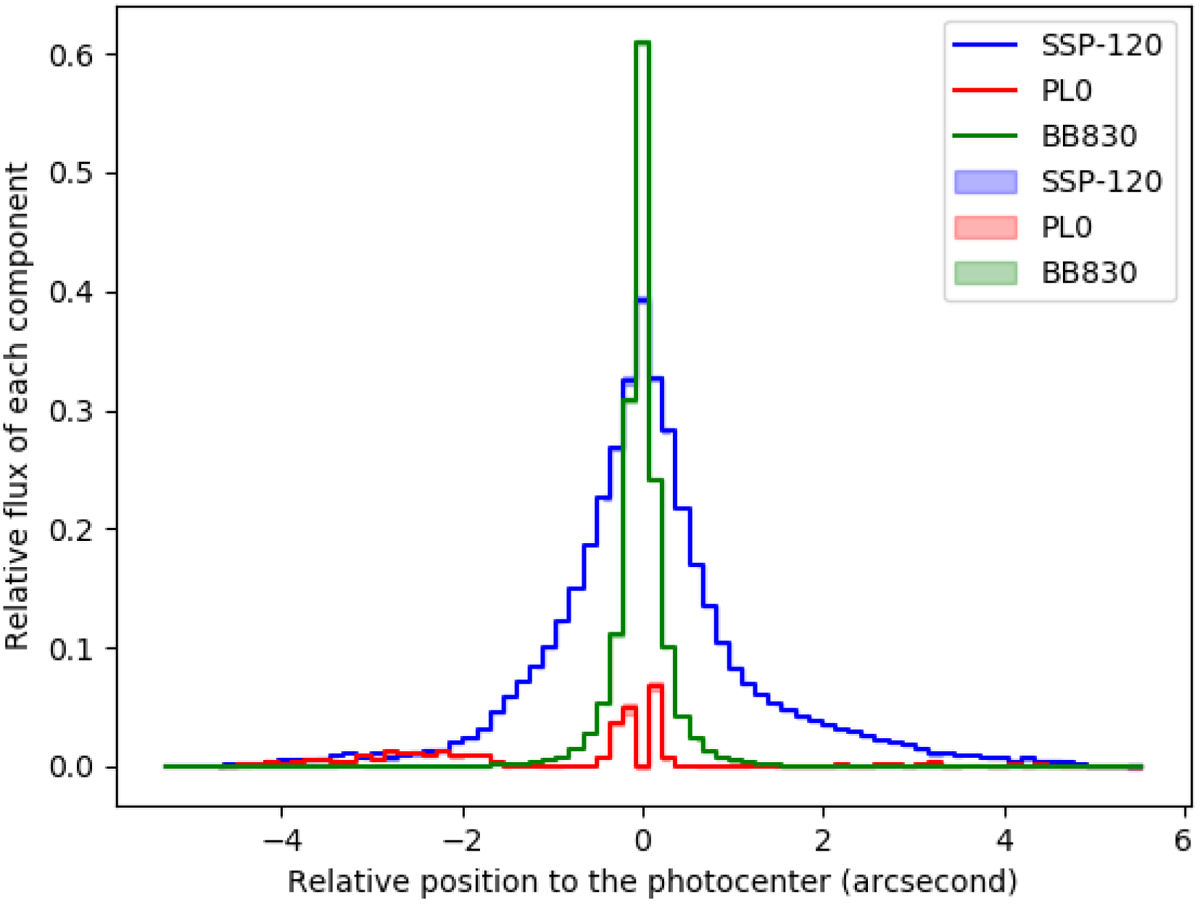
Flux of each component relative to the total flux of the photocenter. The blue, green, and red lines represent the adjusted contribution of the 120 Myr single stellar population, the 830 K blackbody, and the flat continuum.
Current usage metrics show cumulative count of Article Views (full-text article views including HTML views, PDF and ePub downloads, according to the available data) and Abstracts Views on Vision4Press platform.
Data correspond to usage on the plateform after 2015. The current usage metrics is available 48-96 hours after online publication and is updated daily on week days.
Initial download of the metrics may take a while.