Fig. 5.
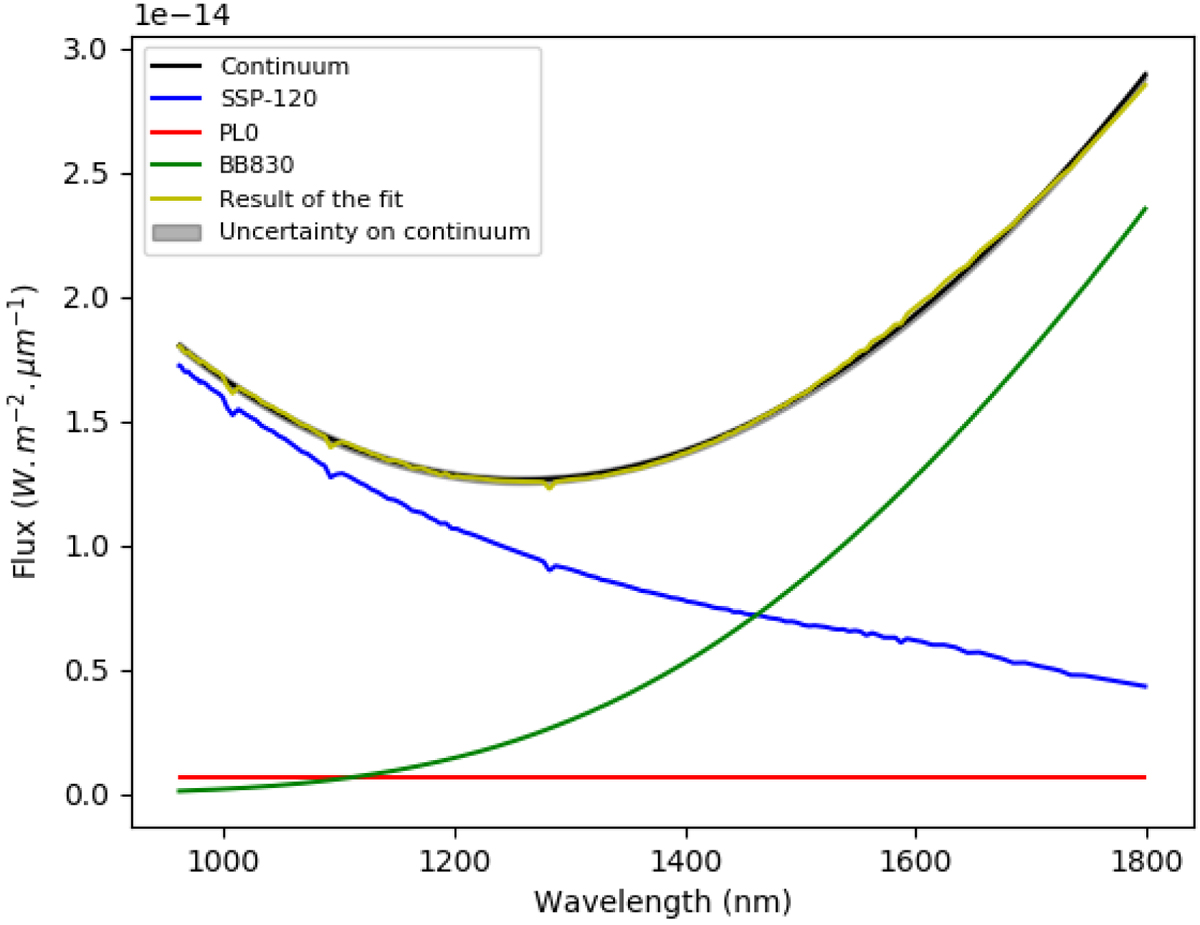
Adjustment of the continuum in the central 0.3″. The black line represents the measured continuum. The blue, green, and red lines represent the adjusted contribution of the 120 Myr single stellar population (SSP-120 in the legend), the 830 K blackbody (BB830), and the flat contribution from scattered light (PL0). The yellow line represents the sum of these contributions.
Current usage metrics show cumulative count of Article Views (full-text article views including HTML views, PDF and ePub downloads, according to the available data) and Abstracts Views on Vision4Press platform.
Data correspond to usage on the plateform after 2015. The current usage metrics is available 48-96 hours after online publication and is updated daily on week days.
Initial download of the metrics may take a while.