Fig. 1.
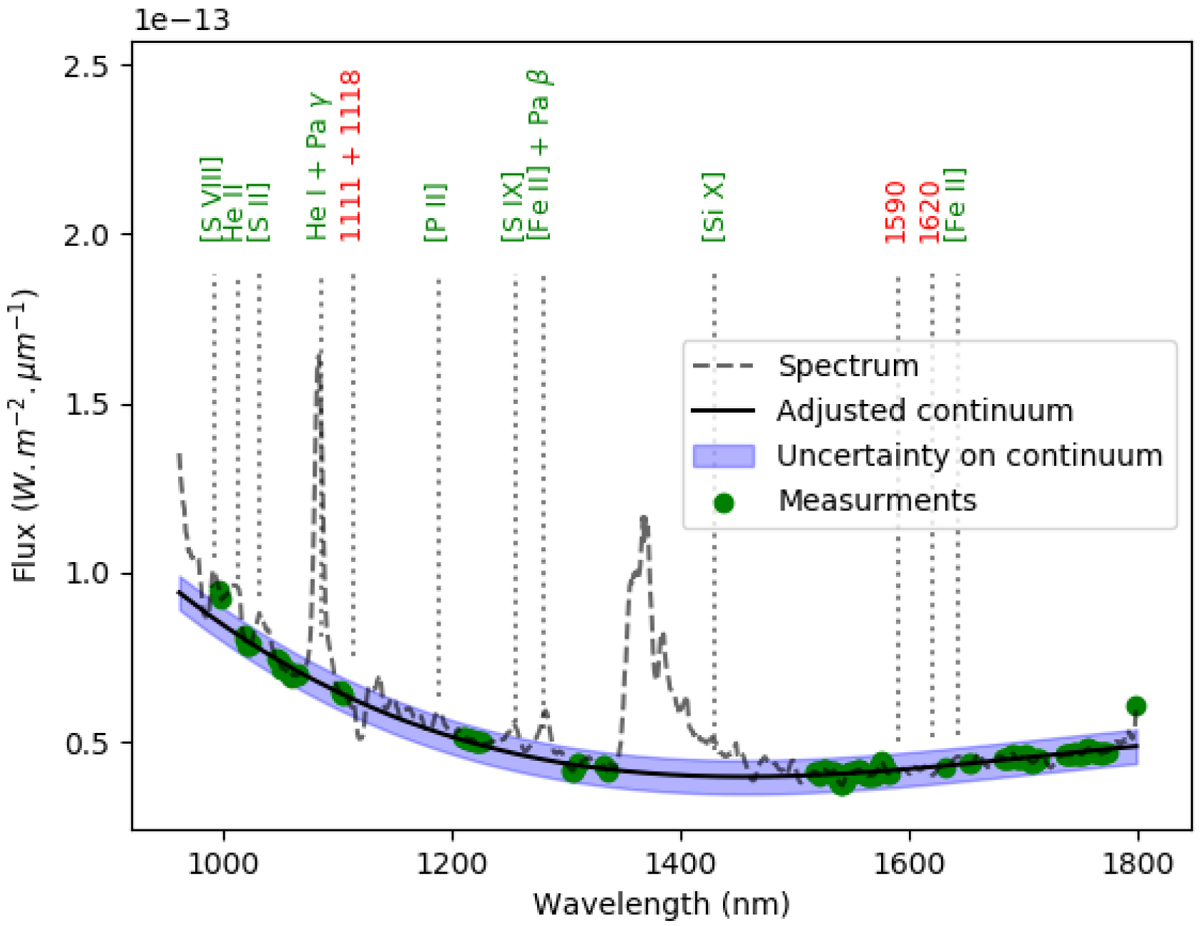
Extraction of the continuum for the spectrum integrated over the entire slit length. The dashed line represents the observed spectrum, the green disks represent the sample values for continuum measurement, and the solid line is the fitted fourth-degree polynomial. The uncertainty on the adjusted continuum is displayed in blue. The location of the emission lines is shown in green, and the location of absorption lines is shown in red (some cannot be shown in this figure because they are visible only in specific regions).
Current usage metrics show cumulative count of Article Views (full-text article views including HTML views, PDF and ePub downloads, according to the available data) and Abstracts Views on Vision4Press platform.
Data correspond to usage on the plateform after 2015. The current usage metrics is available 48-96 hours after online publication and is updated daily on week days.
Initial download of the metrics may take a while.