Free Access
Fig. B.1
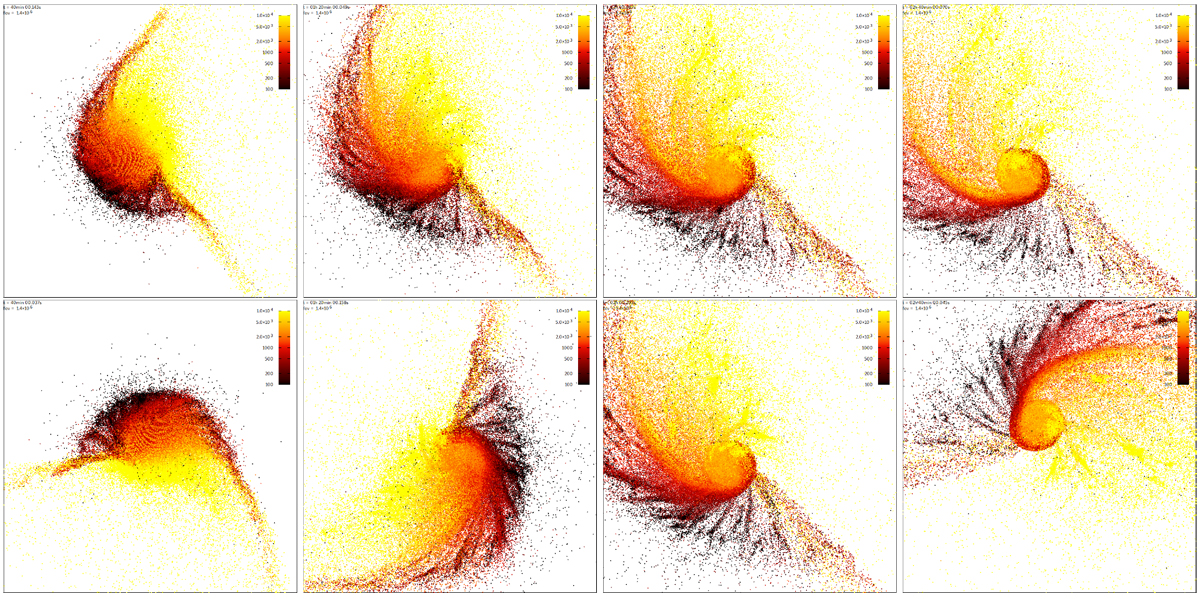
Impact into Dpb = 200 km target. This was computed with a rotating target (upper row) and with a rotating coordinate frame in which the target is stationary (lower row), and plotted at times t = 40, 80, 120, and 160 min after the impact. The color scale represents the specific energy of the particles (in SI units).
Current usage metrics show cumulative count of Article Views (full-text article views including HTML views, PDF and ePub downloads, according to the available data) and Abstracts Views on Vision4Press platform.
Data correspond to usage on the plateform after 2015. The current usage metrics is available 48-96 hours after online publication and is updated daily on week days.
Initial download of the metrics may take a while.