Free Access
Fig. 9.
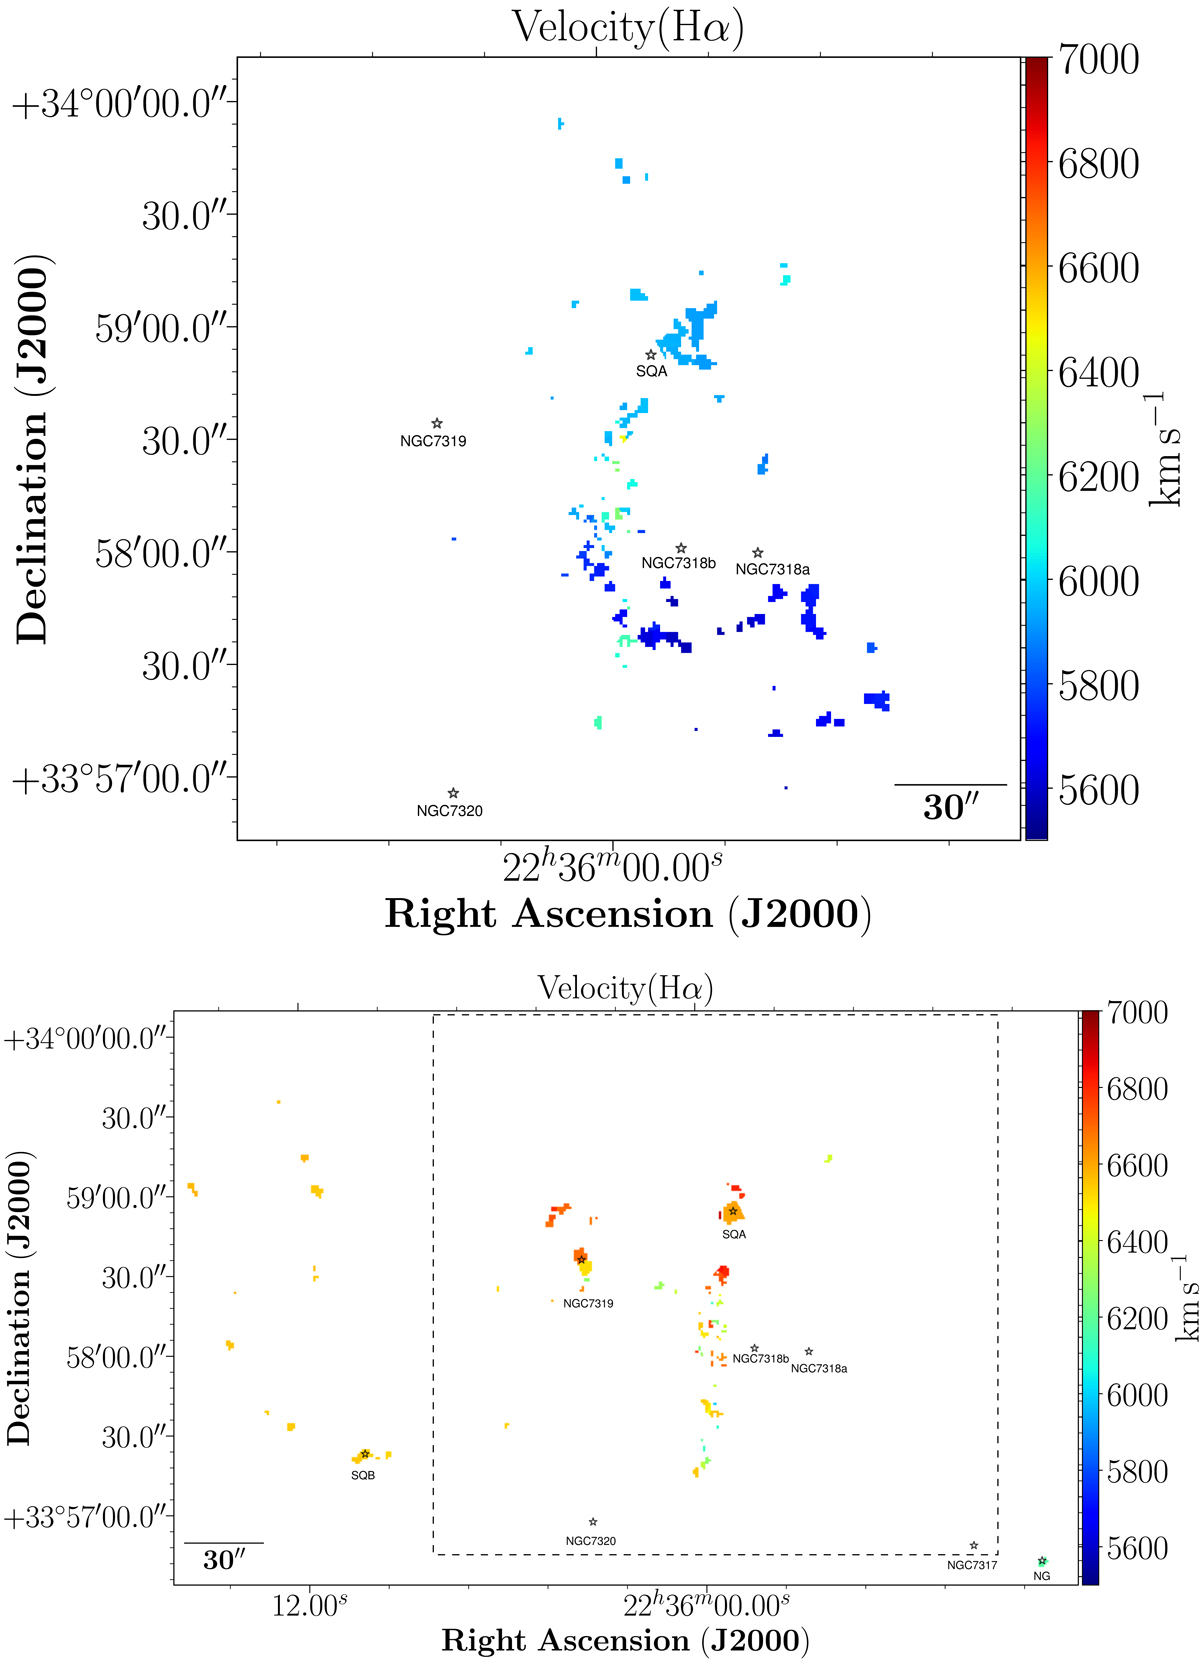
SQ spatial map, colour-coded according to radial velocity of Hα for LV sample (upper panel) and HV sample (lower panel). The box in the lower panel indicates the zoomed zone shown in the upper panel.
Current usage metrics show cumulative count of Article Views (full-text article views including HTML views, PDF and ePub downloads, according to the available data) and Abstracts Views on Vision4Press platform.
Data correspond to usage on the plateform after 2015. The current usage metrics is available 48-96 hours after online publication and is updated daily on week days.
Initial download of the metrics may take a while.