Fig. 8.
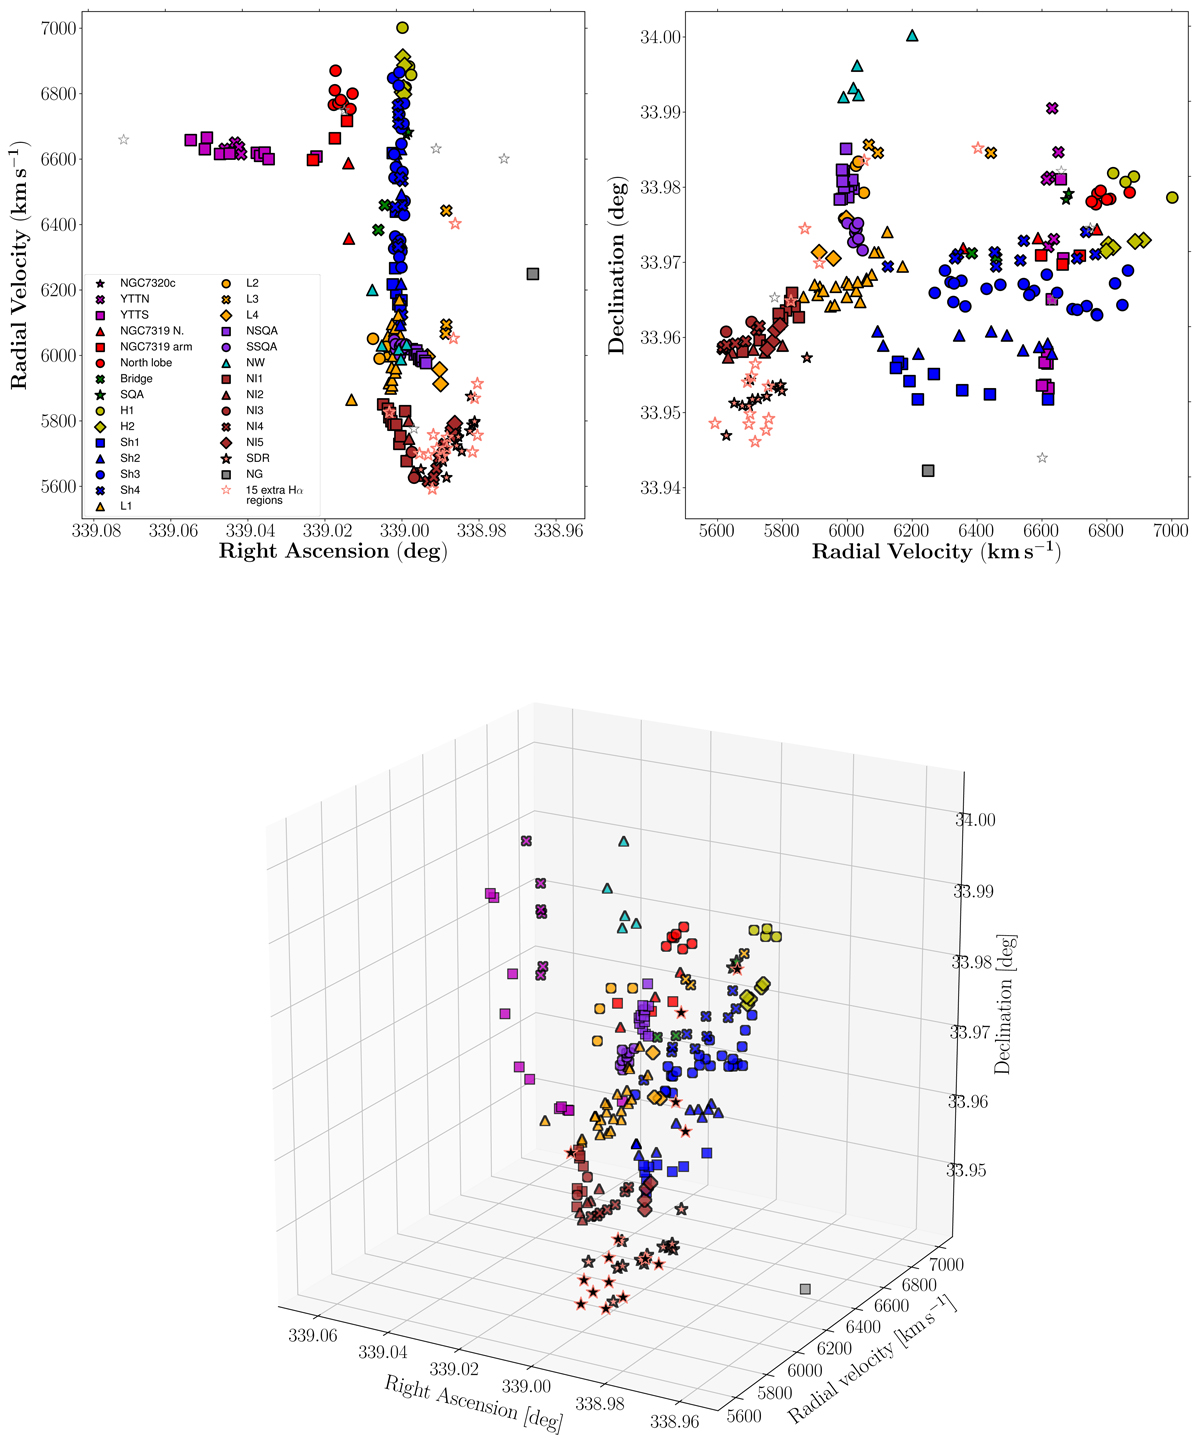
Upper left panel: radial velocity versus RA diagram. Upper right panel: Dec versus radial velocity diagram. Lower panel: three-dimensional view of SQ Hα emission regions (RA, Dec, and radial velocity diagram). All the points in the figures have the same colours and markers as Fig. 7. In both upper panels, the nuclei of NGC 7320c, NGC 7319, NGC 7318B, NGC 7318A, and NGC 7317 are marked with an unfilled grey star.
Current usage metrics show cumulative count of Article Views (full-text article views including HTML views, PDF and ePub downloads, according to the available data) and Abstracts Views on Vision4Press platform.
Data correspond to usage on the plateform after 2015. The current usage metrics is available 48-96 hours after online publication and is updated daily on week days.
Initial download of the metrics may take a while.