Fig. 5.
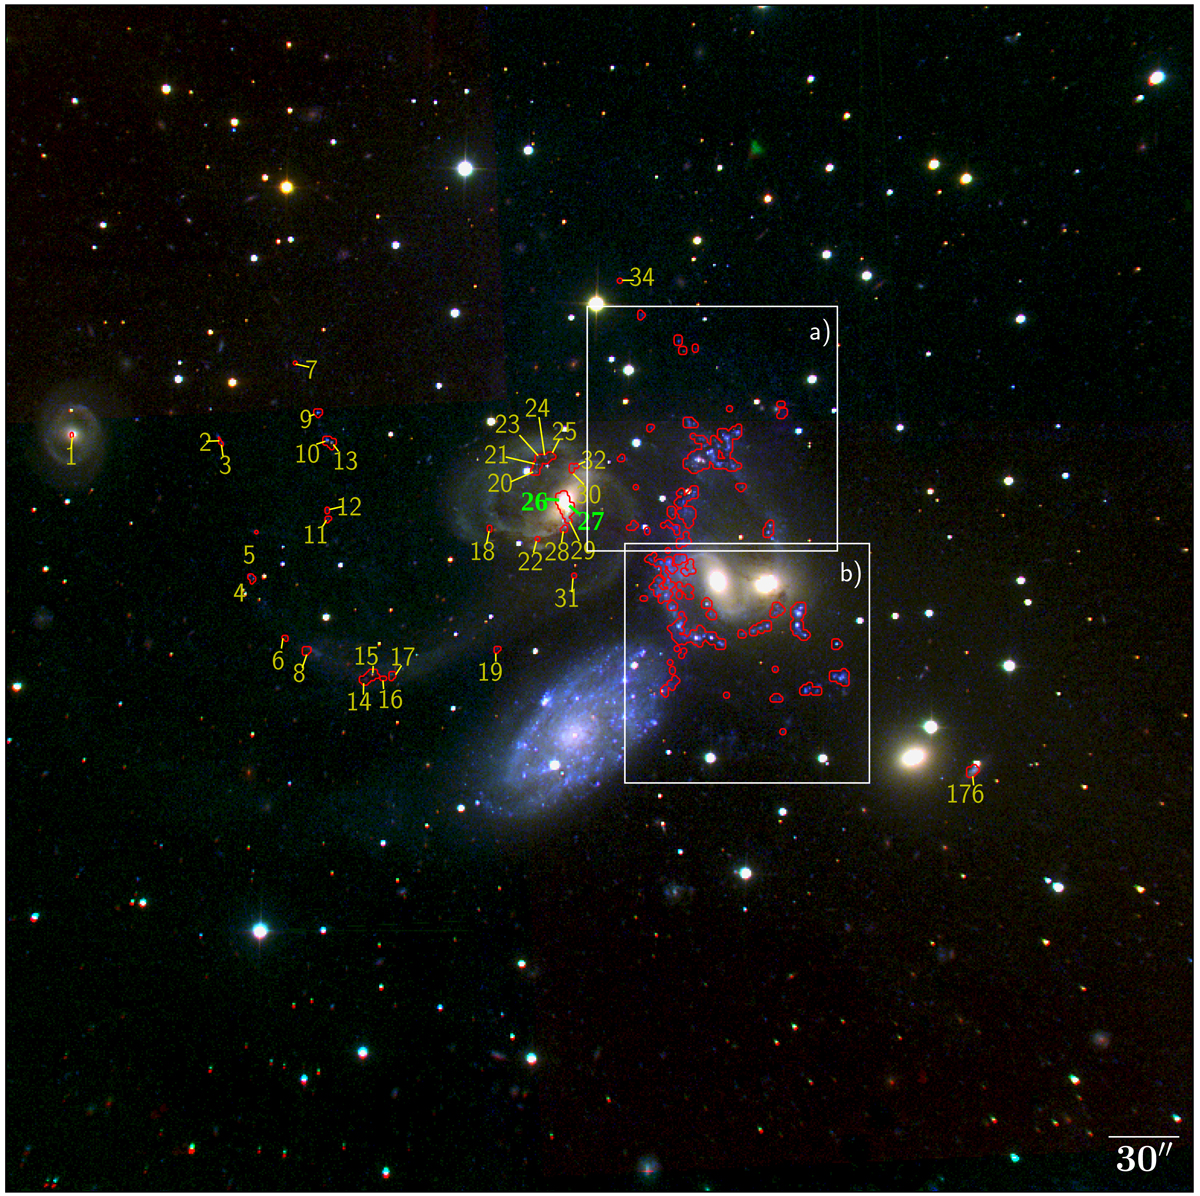
SITELLE composite image from deep SN1, SN2 and SN3 data cubes of SQ. The red lines represent the Hα contours corresponding to all 175 SQ Hα emission regions defined in Sect. 2.3. The Hα regions from YTT, NGC 7319, NGC 7320c, and NG are labelled according to the nomenclature from Table B.1. Green and yellow labels identify the SQ Hα regions showing a broad and narrow line profile, respectively. A zoomed-in view of the areas marked with the white rectangles are shown in Fig. 6.
Current usage metrics show cumulative count of Article Views (full-text article views including HTML views, PDF and ePub downloads, according to the available data) and Abstracts Views on Vision4Press platform.
Data correspond to usage on the plateform after 2015. The current usage metrics is available 48-96 hours after online publication and is updated daily on week days.
Initial download of the metrics may take a while.