Fig. 4.
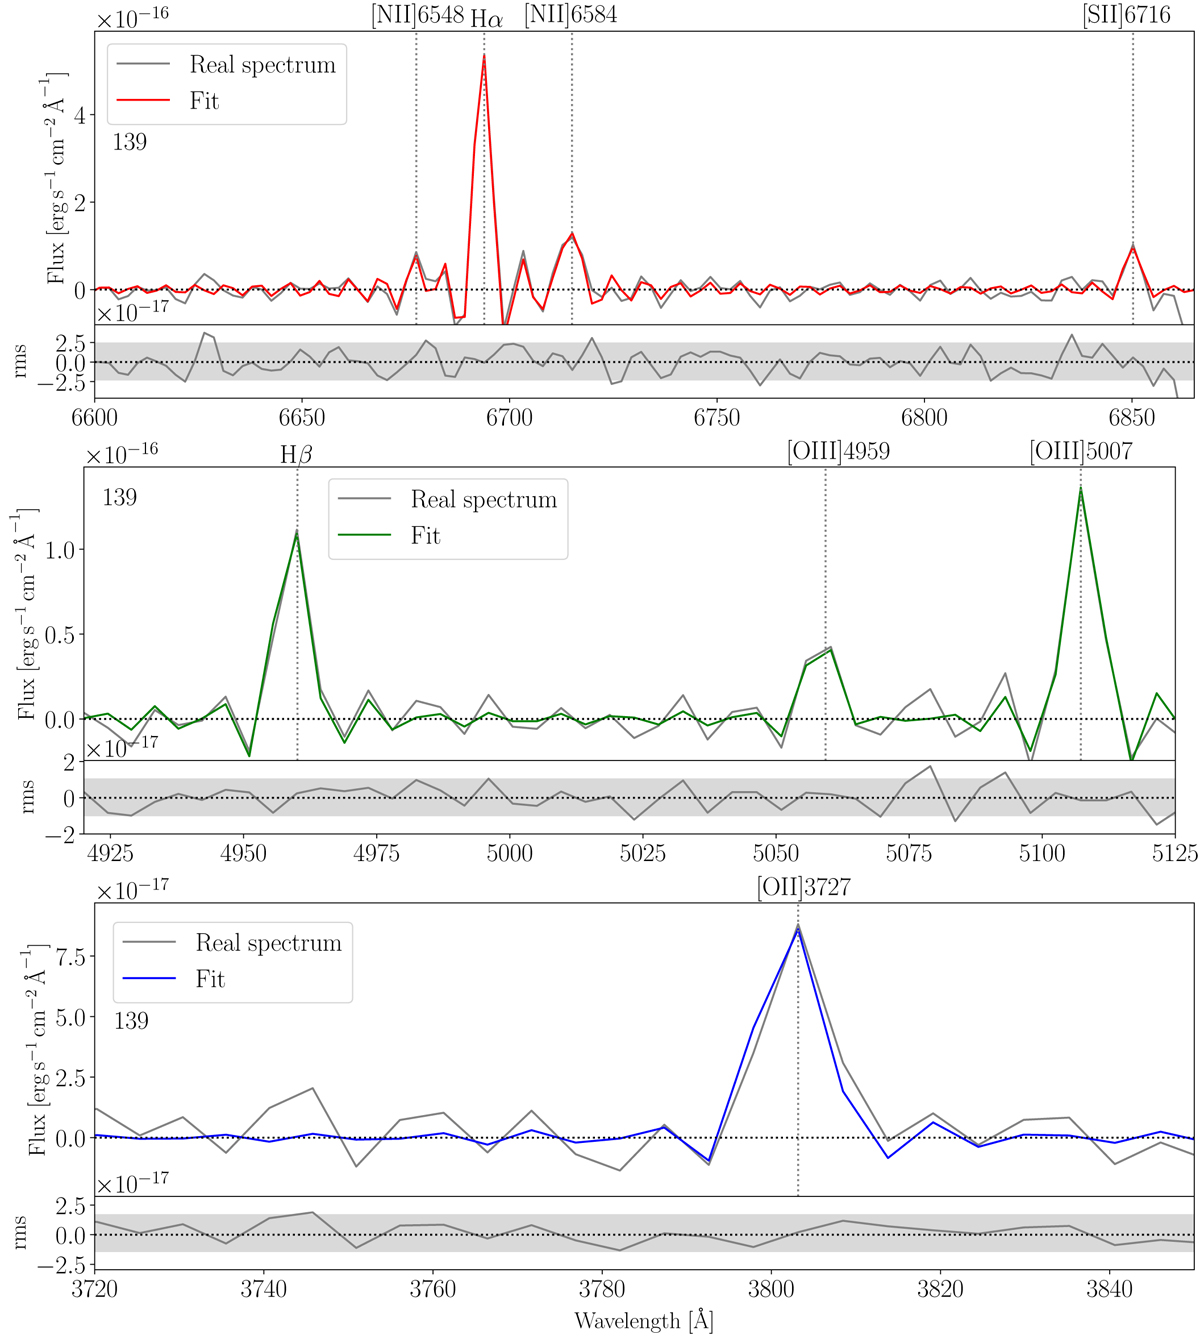
Fitting example: spectra from region 139. In each upper panel, the grey line shows the real spectrum and the red, green, and blue coloured lines show the fit obtained with ORCS in the SN3, SN2, and SN1 filters, respectively. Upper panels: grey dotted lines show the location of the emission lines studied for this region. Lower panels: grey line shows the residual after the fit. The horizontal grey band indicates the 3σ scatter.
Current usage metrics show cumulative count of Article Views (full-text article views including HTML views, PDF and ePub downloads, according to the available data) and Abstracts Views on Vision4Press platform.
Data correspond to usage on the plateform after 2015. The current usage metrics is available 48-96 hours after online publication and is updated daily on week days.
Initial download of the metrics may take a while.