Fig. 14.
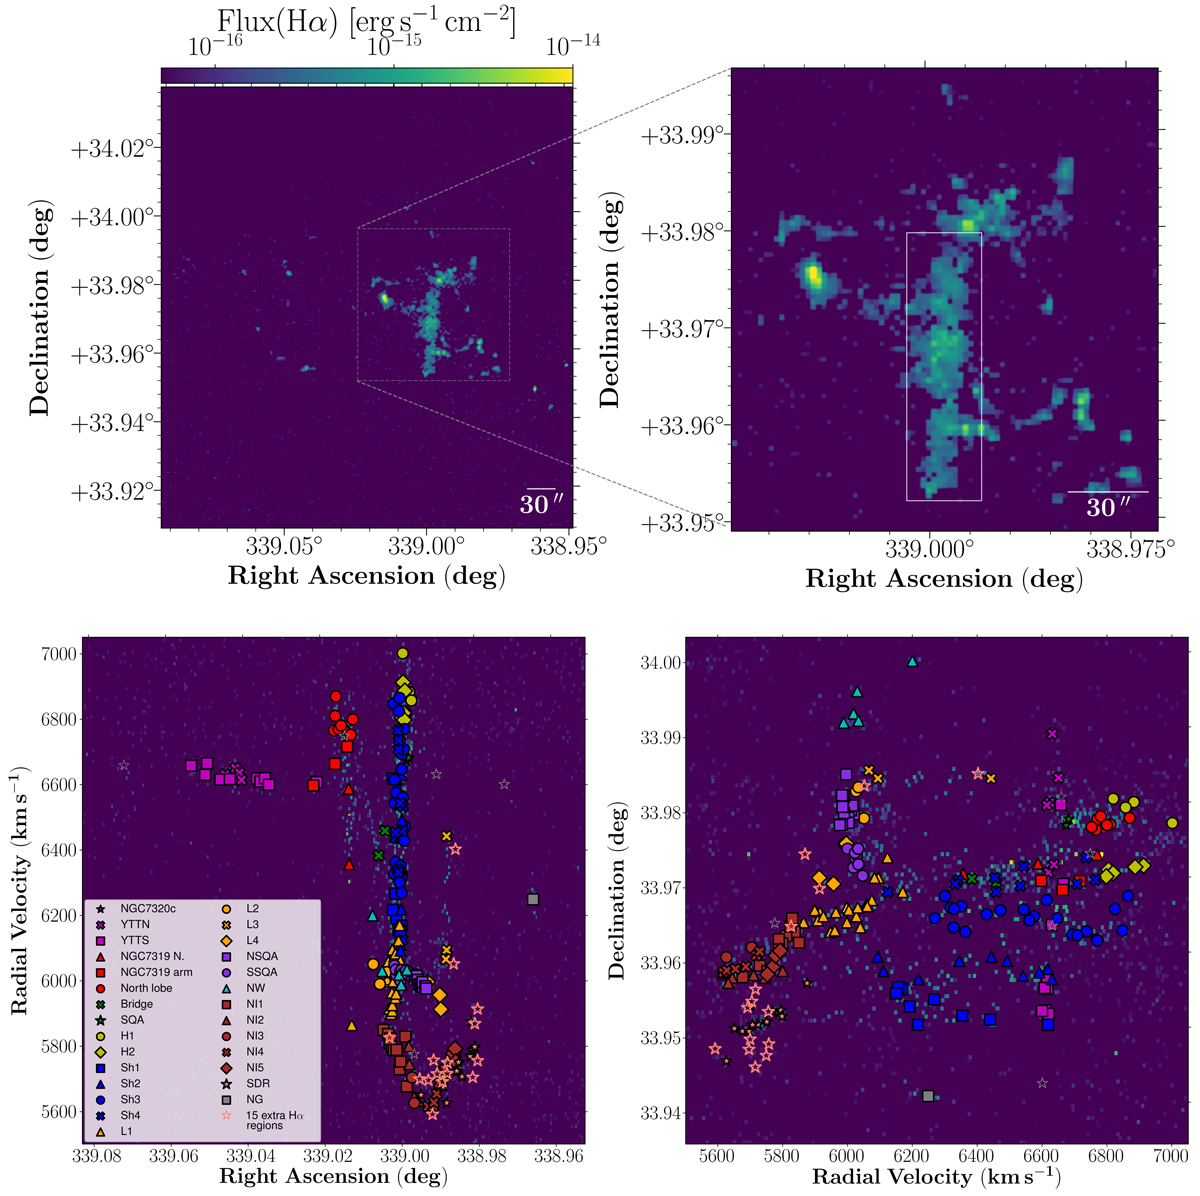
Hα flux spatial map of entire SQ (upper left panel), Hα flux spatial map zoomed in to shock region (upper right panel). Lower left panel: radial velocity versus RA diagram and the lower right panel shows Dec versus radial velocity diagram. All the points in the lower panels of the figures have the same colours and markers as Fig. 7. The white rectangle centred on LSSR is overplotted with a solid line in the upper right panel. This rectangle is centred on the coordinate RA = 339 deg and Dec = 33.966 deg, with a width of ΔRA = 27.786 arcsec and a height of ΔDec = 99.512 arcsec.
Current usage metrics show cumulative count of Article Views (full-text article views including HTML views, PDF and ePub downloads, according to the available data) and Abstracts Views on Vision4Press platform.
Data correspond to usage on the plateform after 2015. The current usage metrics is available 48-96 hours after online publication and is updated daily on week days.
Initial download of the metrics may take a while.