Free Access
Fig. 12.
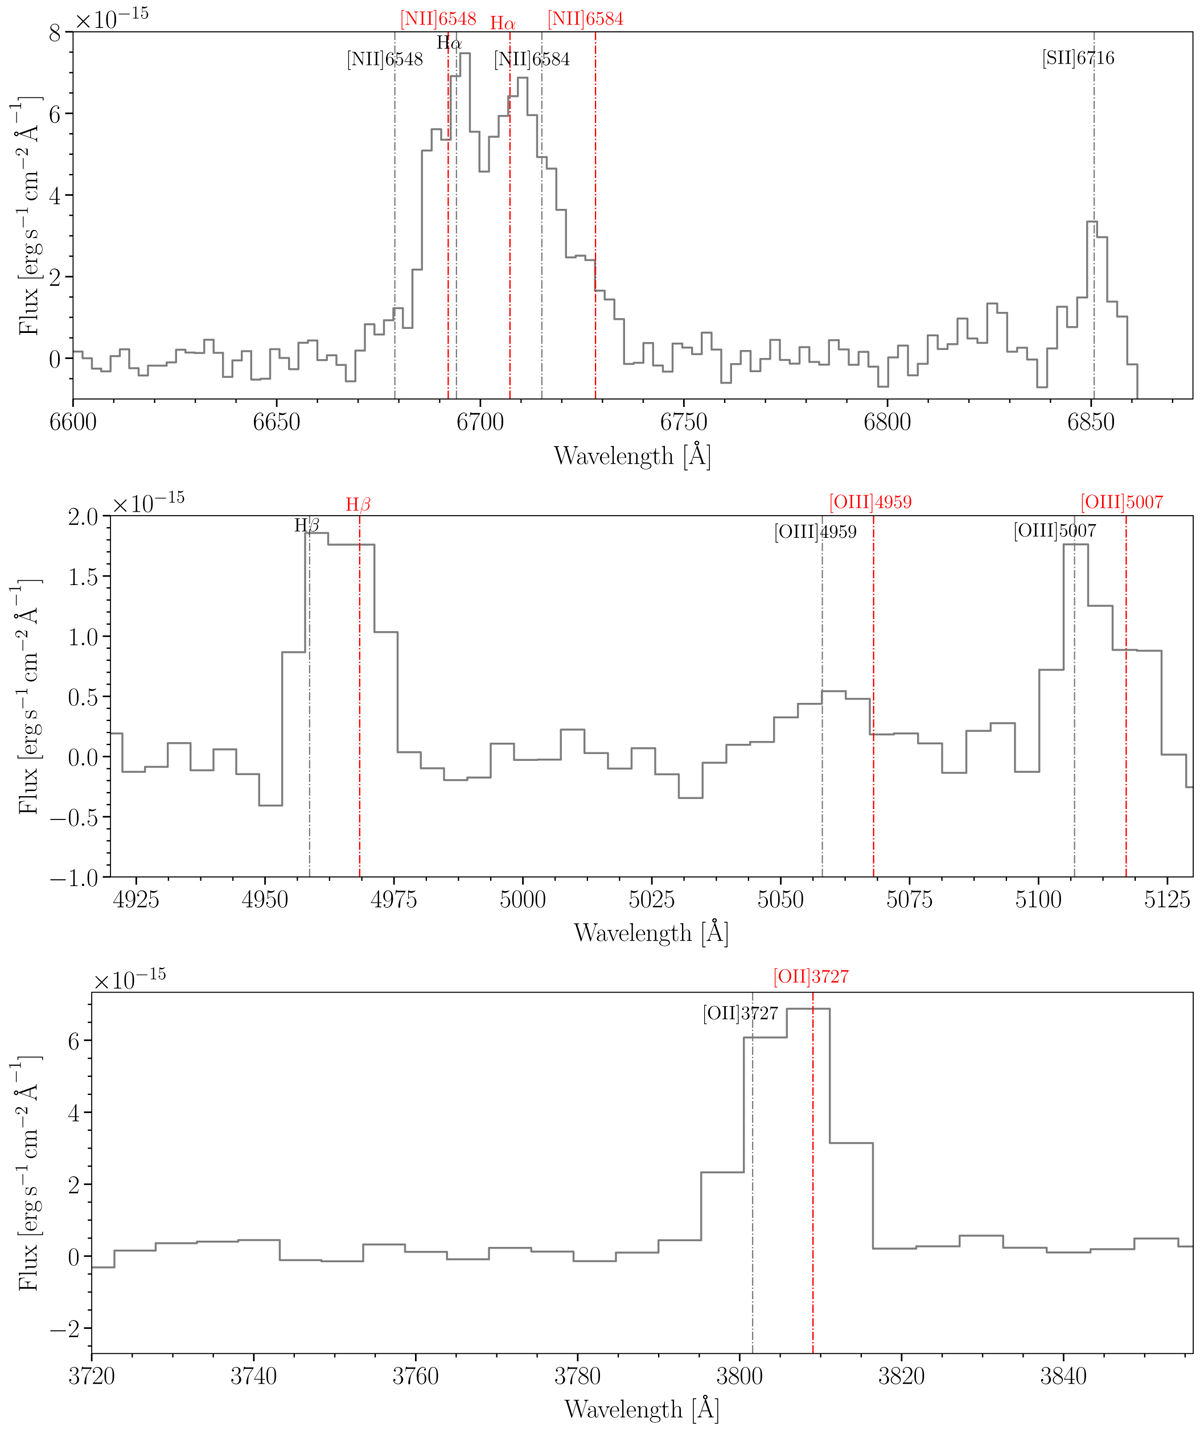
Integrated spectra from large scale shock region in SN3, SN2, and SN1 data cubes. The black and red vertical dashed lines show the position of the emission lines studied at Hα radial velocities of 6000 km s−1 and 6600 km s−1, respectively.
Current usage metrics show cumulative count of Article Views (full-text article views including HTML views, PDF and ePub downloads, according to the available data) and Abstracts Views on Vision4Press platform.
Data correspond to usage on the plateform after 2015. The current usage metrics is available 48-96 hours after online publication and is updated daily on week days.
Initial download of the metrics may take a while.