Fig. 10.
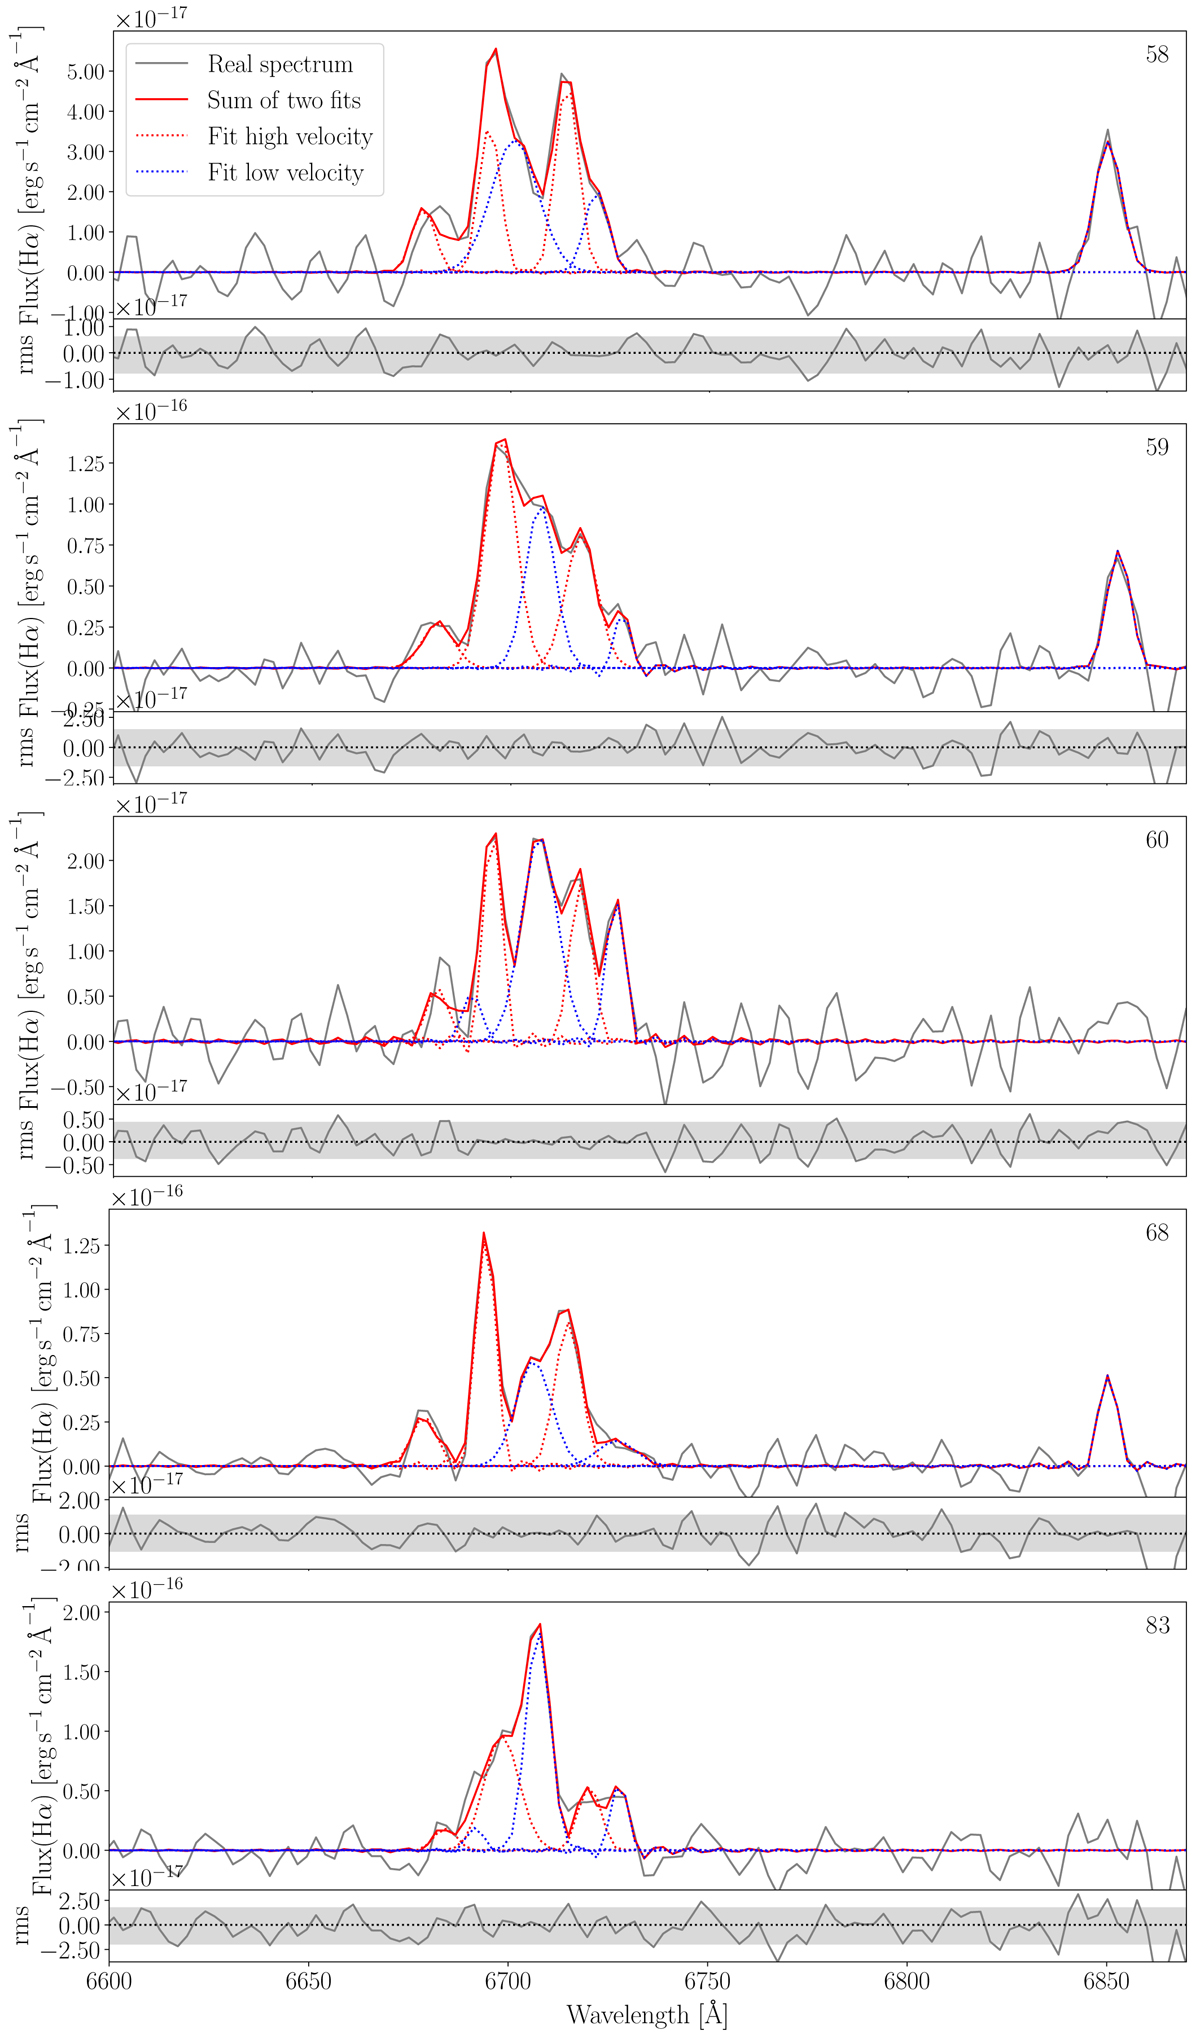
From top to bottom: examples of the line fits from regions 58, 59, 60, 68, and 83 with a broad line profile. In each upper panel, the grey line shows the real spectrum, and the red and blue dotted lines correspond to the fit of the low and high velocity components. The red solid line shows the sum of the two velocity component fits. The name of the region is indicated in each upper panel (top right). Lower panels: grey line shows the residual after the fit. The horizontal grey band indicates the 3σ scatter.
Current usage metrics show cumulative count of Article Views (full-text article views including HTML views, PDF and ePub downloads, according to the available data) and Abstracts Views on Vision4Press platform.
Data correspond to usage on the plateform after 2015. The current usage metrics is available 48-96 hours after online publication and is updated daily on week days.
Initial download of the metrics may take a while.