Fig. 1
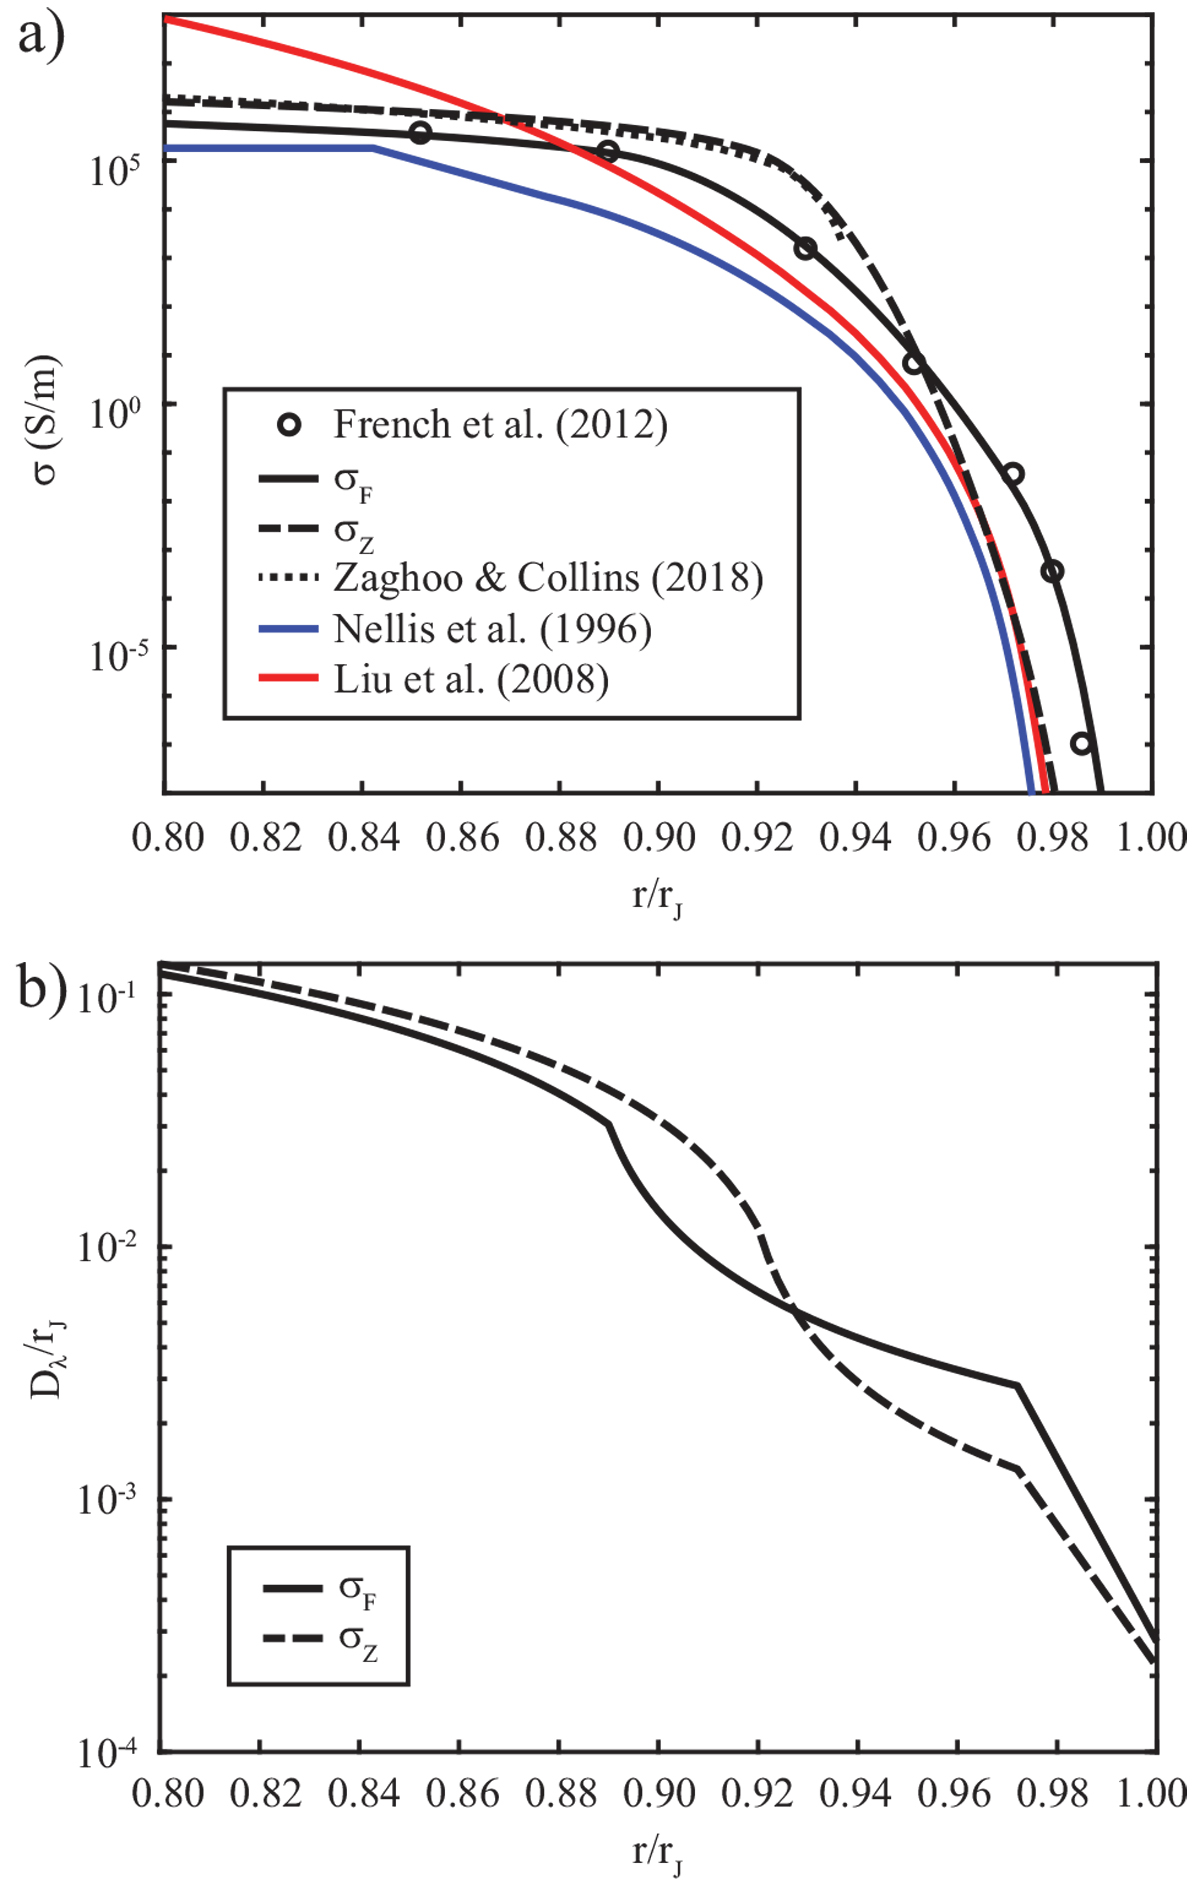
Panela: electrical conductivity profiles in the outer 20% of the radius of Jupiter. The black line shows the parametrization σF(r) of the ab initio simulation data points (black circles) by French et al. (2012). The dotted red line shows theprofile published in Zaghoo & Collins (2018), while the solid red line shows the extension σZ (r) used here. The profiles suggested by Liu et al. (2008) (green) and Nellis et al. (1999) (blue) are shown for comparison. Panel b: magnetic diffusivity scale height Dλ ∕rJ for σF and σZ.
Current usage metrics show cumulative count of Article Views (full-text article views including HTML views, PDF and ePub downloads, according to the available data) and Abstracts Views on Vision4Press platform.
Data correspond to usage on the plateform after 2015. The current usage metrics is available 48-96 hours after online publication and is updated daily on week days.
Initial download of the metrics may take a while.