Fig. 9.
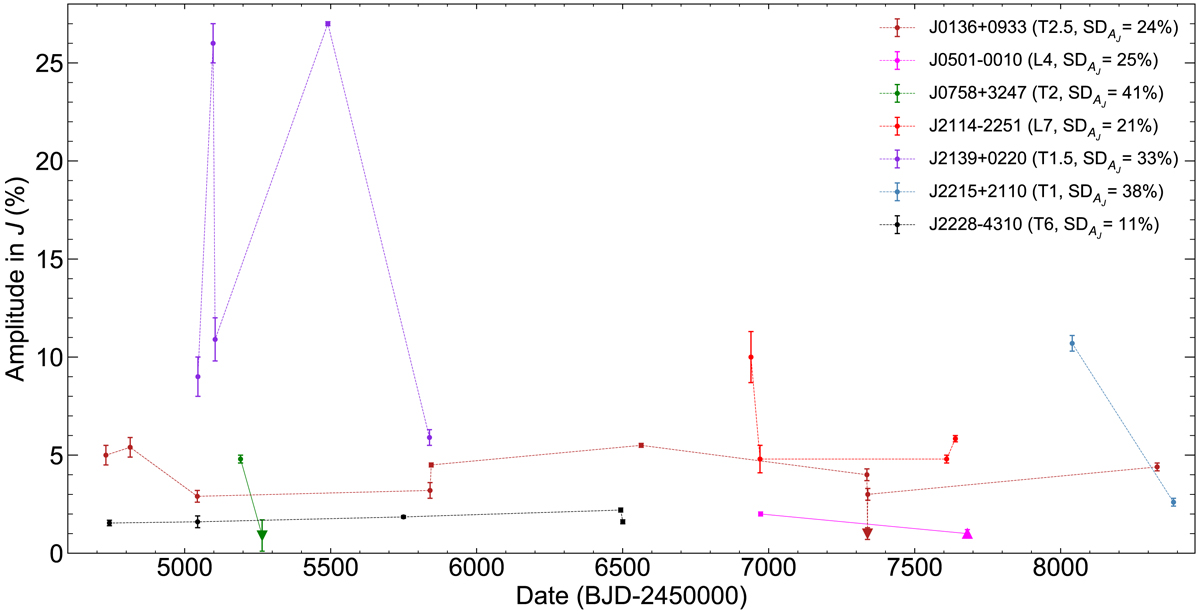
Peak-to-peak amplitudes in J against BJD−2450000, illustrating the long-term evolution over several epochs for a number of strong variables in the literature with multi-epoch observations. The first epoch plotted is for J0136 in 2008-09-21, amplitude uncertainties are indicated by error bars and epochs with upper/lower limits are plotted with triangles. One object, the T6 J2228 stands out as being relatively stable, indicated in the legend by SDAJ, the standard deviation (SD) for a given object obtained from the SD of all epochs normalised by the maximum amplitude.
Current usage metrics show cumulative count of Article Views (full-text article views including HTML views, PDF and ePub downloads, according to the available data) and Abstracts Views on Vision4Press platform.
Data correspond to usage on the plateform after 2015. The current usage metrics is available 48-96 hours after online publication and is updated daily on week days.
Initial download of the metrics may take a while.