Fig. 8.
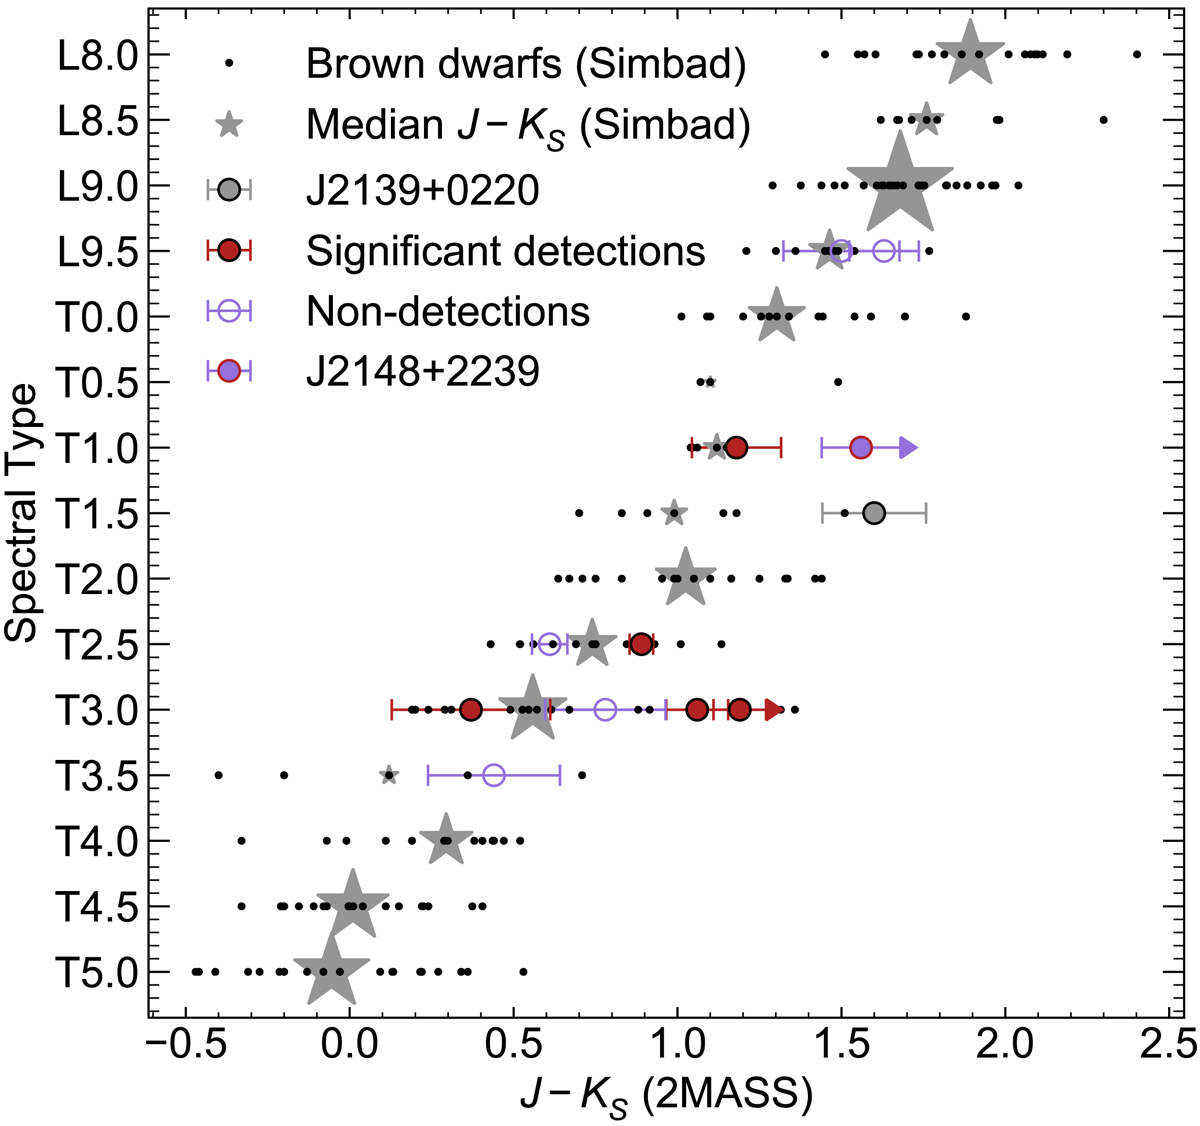
Colour (J − KS) vs Spectral Type diagram illustrating distribution of our targets in terms of colour anomaly. Black points show 203 brown dwarfs in the L/T transition gathered by criteria from the SIMBAD database for various SpT, with the median colour shown as a grey star for a given SpT (size proportional to the number of BDs in that bin). J2139+0220 is included for reference as it is very strongly variable and has been shown to inclined at 90°. Detections and non-detections are shown with J − KS error bars in dark red filled and purple empty circles respectively, with the marginal detection of J2148 shown as a combination of the two. Poorly constrained 2MASS KS photometry for J2148 and J2239 is indicated by upper limit arrows.
Current usage metrics show cumulative count of Article Views (full-text article views including HTML views, PDF and ePub downloads, according to the available data) and Abstracts Views on Vision4Press platform.
Data correspond to usage on the plateform after 2015. The current usage metrics is available 48-96 hours after online publication and is updated daily on week days.
Initial download of the metrics may take a while.