Fig. 7.
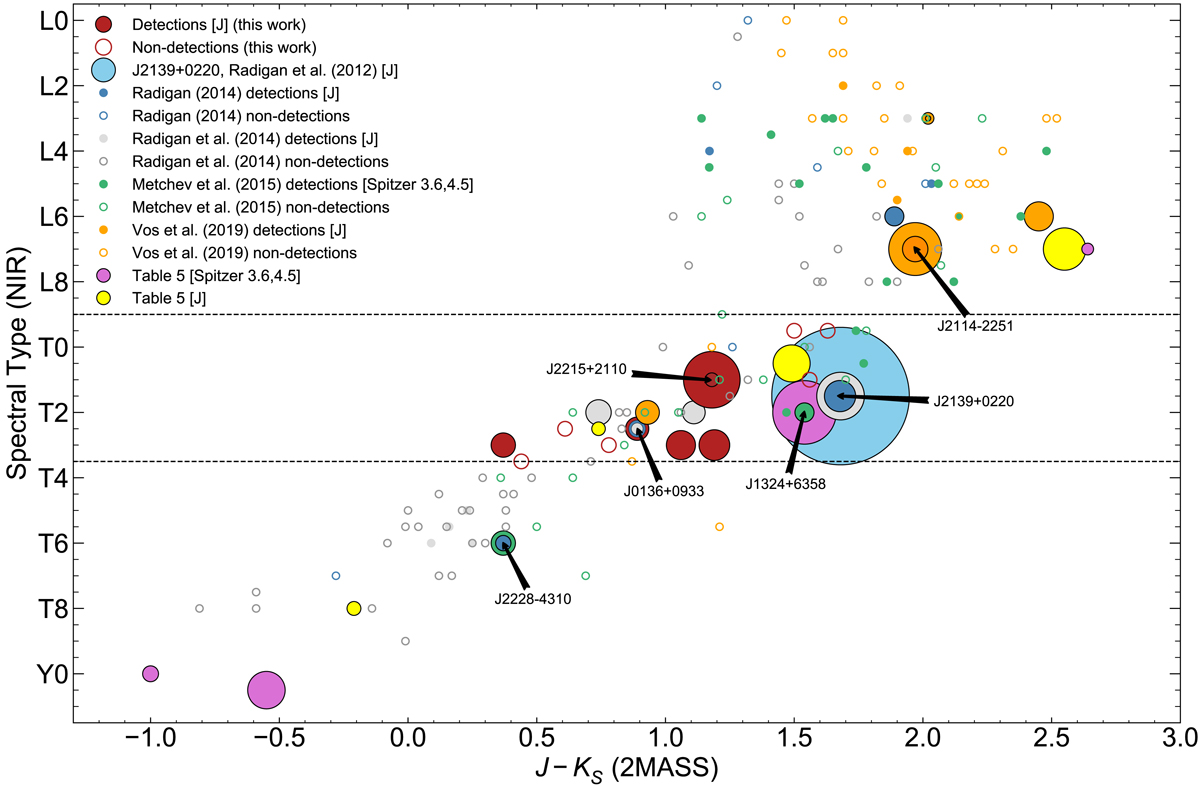
Colour (J − KS) vs Spectral Type diagram showing detections (filled circles) and non-detections (empty circles) of variability from numerous sources in the literature, including the strong variables listed in Table D.1. Circle size is proportional to the peak-to-peak amplitude, with the smallest filled circles indicating < 2% and larger ones indicating strong variability, ranging from 2 to 26%. Detections from this work, representing a significant addition to known strongly variable T-dwarfs, and non-detections are shown in dark red filled and larger empty circles respectively, all 11 present within the L9–T3.5 L/T transition indicated by the two dashed lines. The three large variability surveys done by Radigan et al. (2014) (grey circles), Metchev et al. (2015) (green) and Vos et al. (2019) (orange) included 62, 44 and 30 BDs respectively. The independent analysis of the Wilson et al. (2014) survey by Radigan et al. (2014) (teal circles) included another 14. The largest amplitude observed by Radigan et al. (2012) is indicated by the largest (light blue) circle. Pink and yellow filled circles represent a number of other strong variables from Table D.1.
Current usage metrics show cumulative count of Article Views (full-text article views including HTML views, PDF and ePub downloads, according to the available data) and Abstracts Views on Vision4Press platform.
Data correspond to usage on the plateform after 2015. The current usage metrics is available 48-96 hours after online publication and is updated daily on week days.
Initial download of the metrics may take a while.