Fig. C.1.
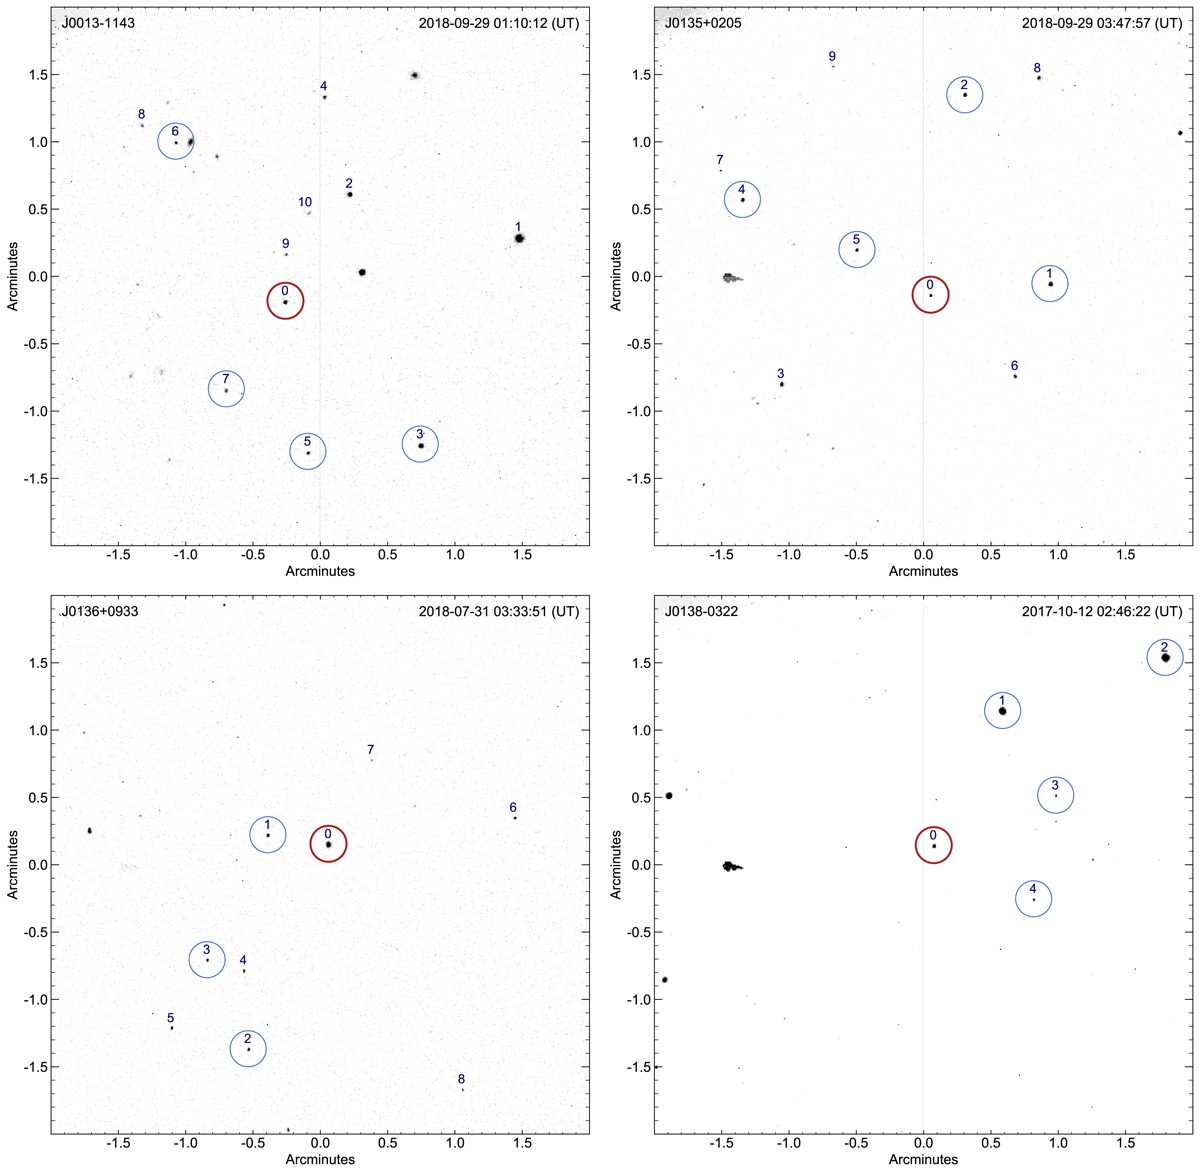
Finding charts for the first four epochs (J0013 in 2018 to J0138 in 2017) in Table 2. Photometry was performed on all numbered objects, starting with the target (number zero) and reference stars (numbers 1–n). The thicker red circle, radii ∼30 pixels or 0.1 arcmin, indicates the target while the thinner blue circles indicate the reference stars used for the final light curves presented in Sect. 4. The faint grey column in the middle consists of dead pixels and the elongated feature on the left present in some images is a cluster of cold pixels. These bad pixel features are not visible in all finding charts due to the chosen image contrast.
Current usage metrics show cumulative count of Article Views (full-text article views including HTML views, PDF and ePub downloads, according to the available data) and Abstracts Views on Vision4Press platform.
Data correspond to usage on the plateform after 2015. The current usage metrics is available 48-96 hours after online publication and is updated daily on week days.
Initial download of the metrics may take a while.