Fig. B.1.
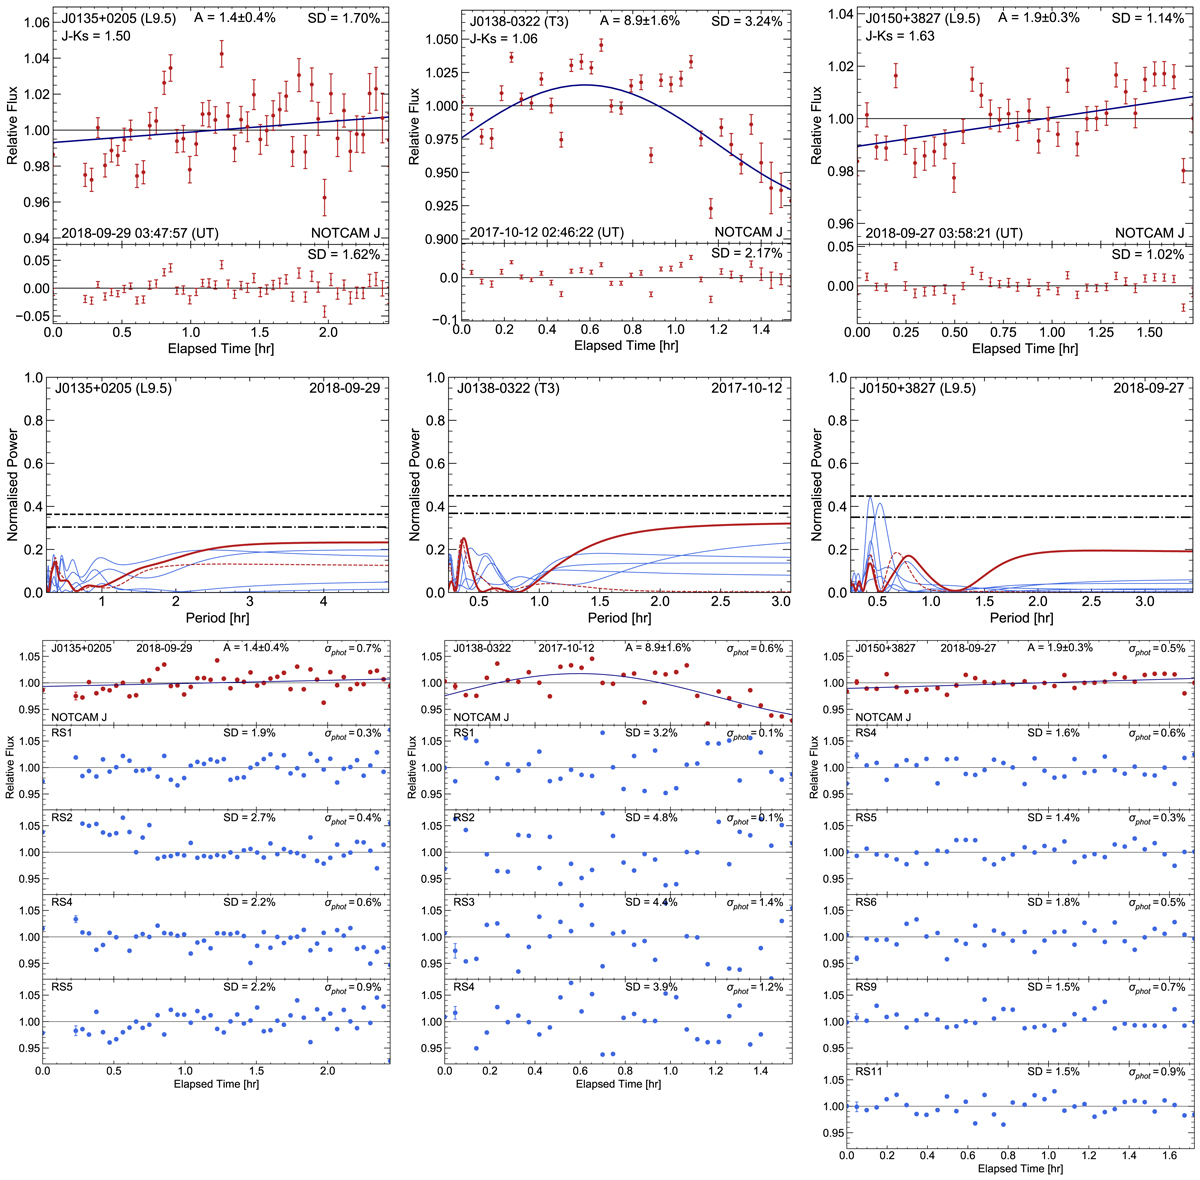
Plots for the non-detection observations of J0135 in 2017 (left set of three figures), J0138 in 2017 (middle set) and J0150 in 2018 (right set). (I) For a given set of figures, the top figure consisting of two panels shows the final light curve with photometric uncertainties (red circles with error bars) with the best fit (dark blue solid line). The peak-to-peak amplitude and uncertainty from the fit along with the standard deviation (SD) of the light curve are also listed. The bottom panel shows the residual light curve (data-fit) its SD. (II) The middle figure shows the generalised Lomb-Scargle periodogram for the target (thick solid red line), reference stars (thin blue lines) and the target residual (dashed red line). The horizontal upper dashed, lower dotted and dashed lines represent the 0.1% and 1.0% false alarm probability levels respectively. (III) In the bottom figure, the top panel shows the target light curve (red circles), the best fit (dark blue solid line). The remaining panels show the light curves of the reference stars (RS) used to create the median combined reference trend. The mean photometric uncertainties for the target and RS are also indicated by the error bar on the second data point.
Current usage metrics show cumulative count of Article Views (full-text article views including HTML views, PDF and ePub downloads, according to the available data) and Abstracts Views on Vision4Press platform.
Data correspond to usage on the plateform after 2015. The current usage metrics is available 48-96 hours after online publication and is updated daily on week days.
Initial download of the metrics may take a while.