Fig. A.1.
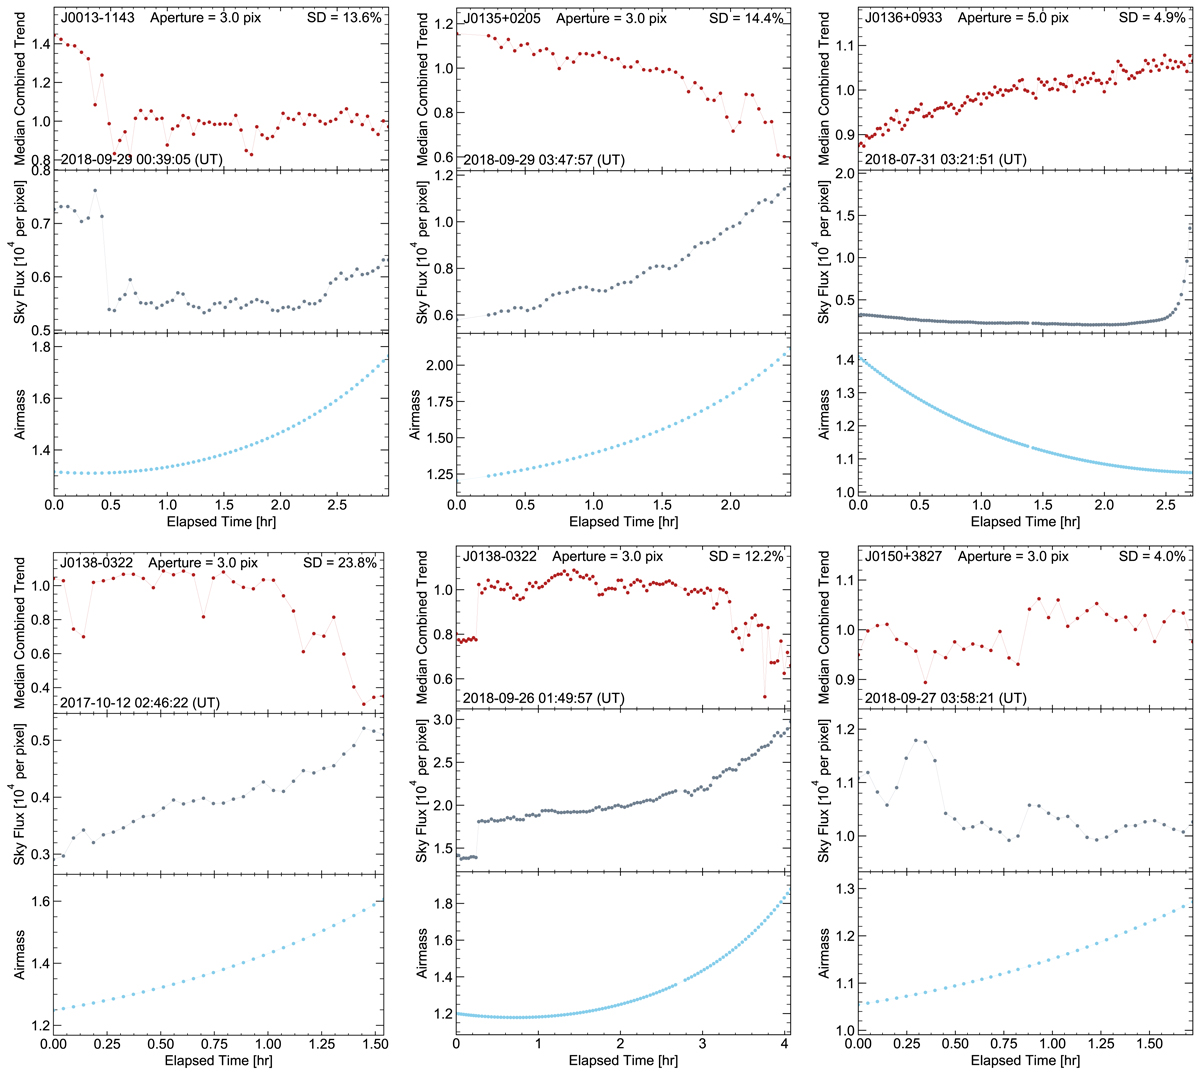
Three-panel figures for six epochs illustrating the quality of the local observing conditions. (I) Top panel, in a given figure: (normalised) median combined reference trend obtained from the selected set of reference stars for a given observation. Also listed is the chosen aperture size (in pixels) and the standard deviation of the trend curve. (II) Middle panel: background sky flux per pixel. (III) Bottom panel: airmass evolution and gives an easy overview of the number and frequency of discarded or lost frames.
Current usage metrics show cumulative count of Article Views (full-text article views including HTML views, PDF and ePub downloads, according to the available data) and Abstracts Views on Vision4Press platform.
Data correspond to usage on the plateform after 2015. The current usage metrics is available 48-96 hours after online publication and is updated daily on week days.
Initial download of the metrics may take a while.