Fig. 10.
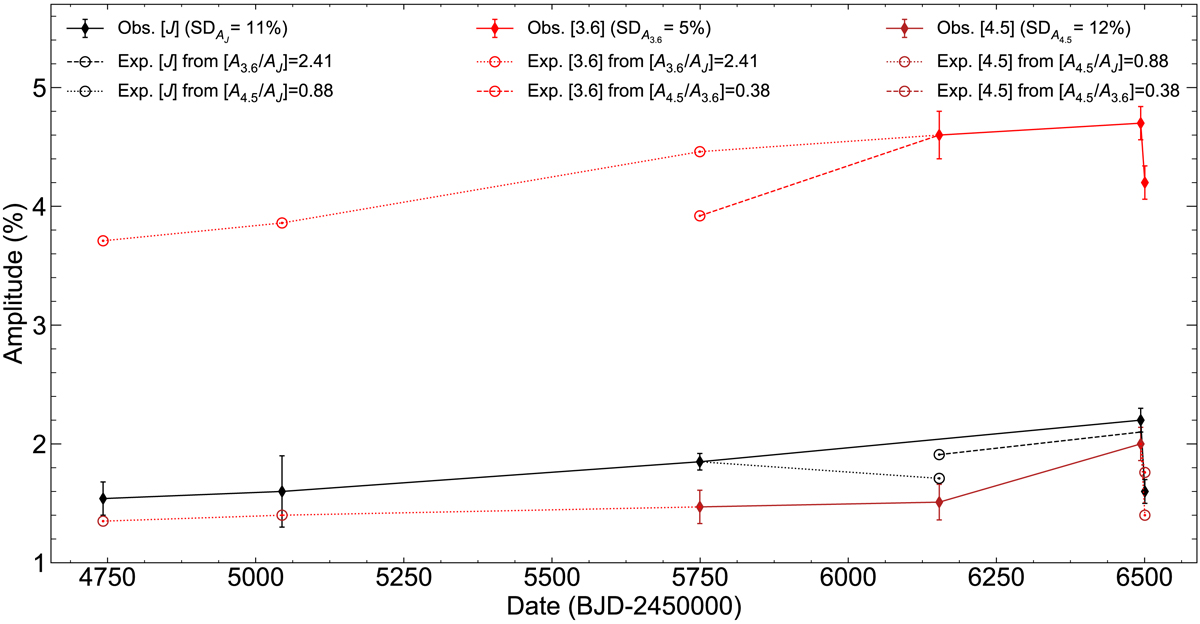
Peak-to-peak amplitudes against BJD−2450000, showing the amplitude evolution for the T6 J2228−4310 in J (black points), 3.6 μm (bright red) and 4.5 μm (dark red). Observed amplitudes are indicated by solid lines and calculated expected amplitudes (based on empiric amplitude ratios) by empty circles with dashed or dotted lines. By using empiric amplitude ratios obtained from simultaneous observations (given in legend), one can calculate an expected amplitude at a given epoch for a given filter. This process is described in detail in Sect. 5.1.2.
Current usage metrics show cumulative count of Article Views (full-text article views including HTML views, PDF and ePub downloads, according to the available data) and Abstracts Views on Vision4Press platform.
Data correspond to usage on the plateform after 2015. The current usage metrics is available 48-96 hours after online publication and is updated daily on week days.
Initial download of the metrics may take a while.