Fig. 1.
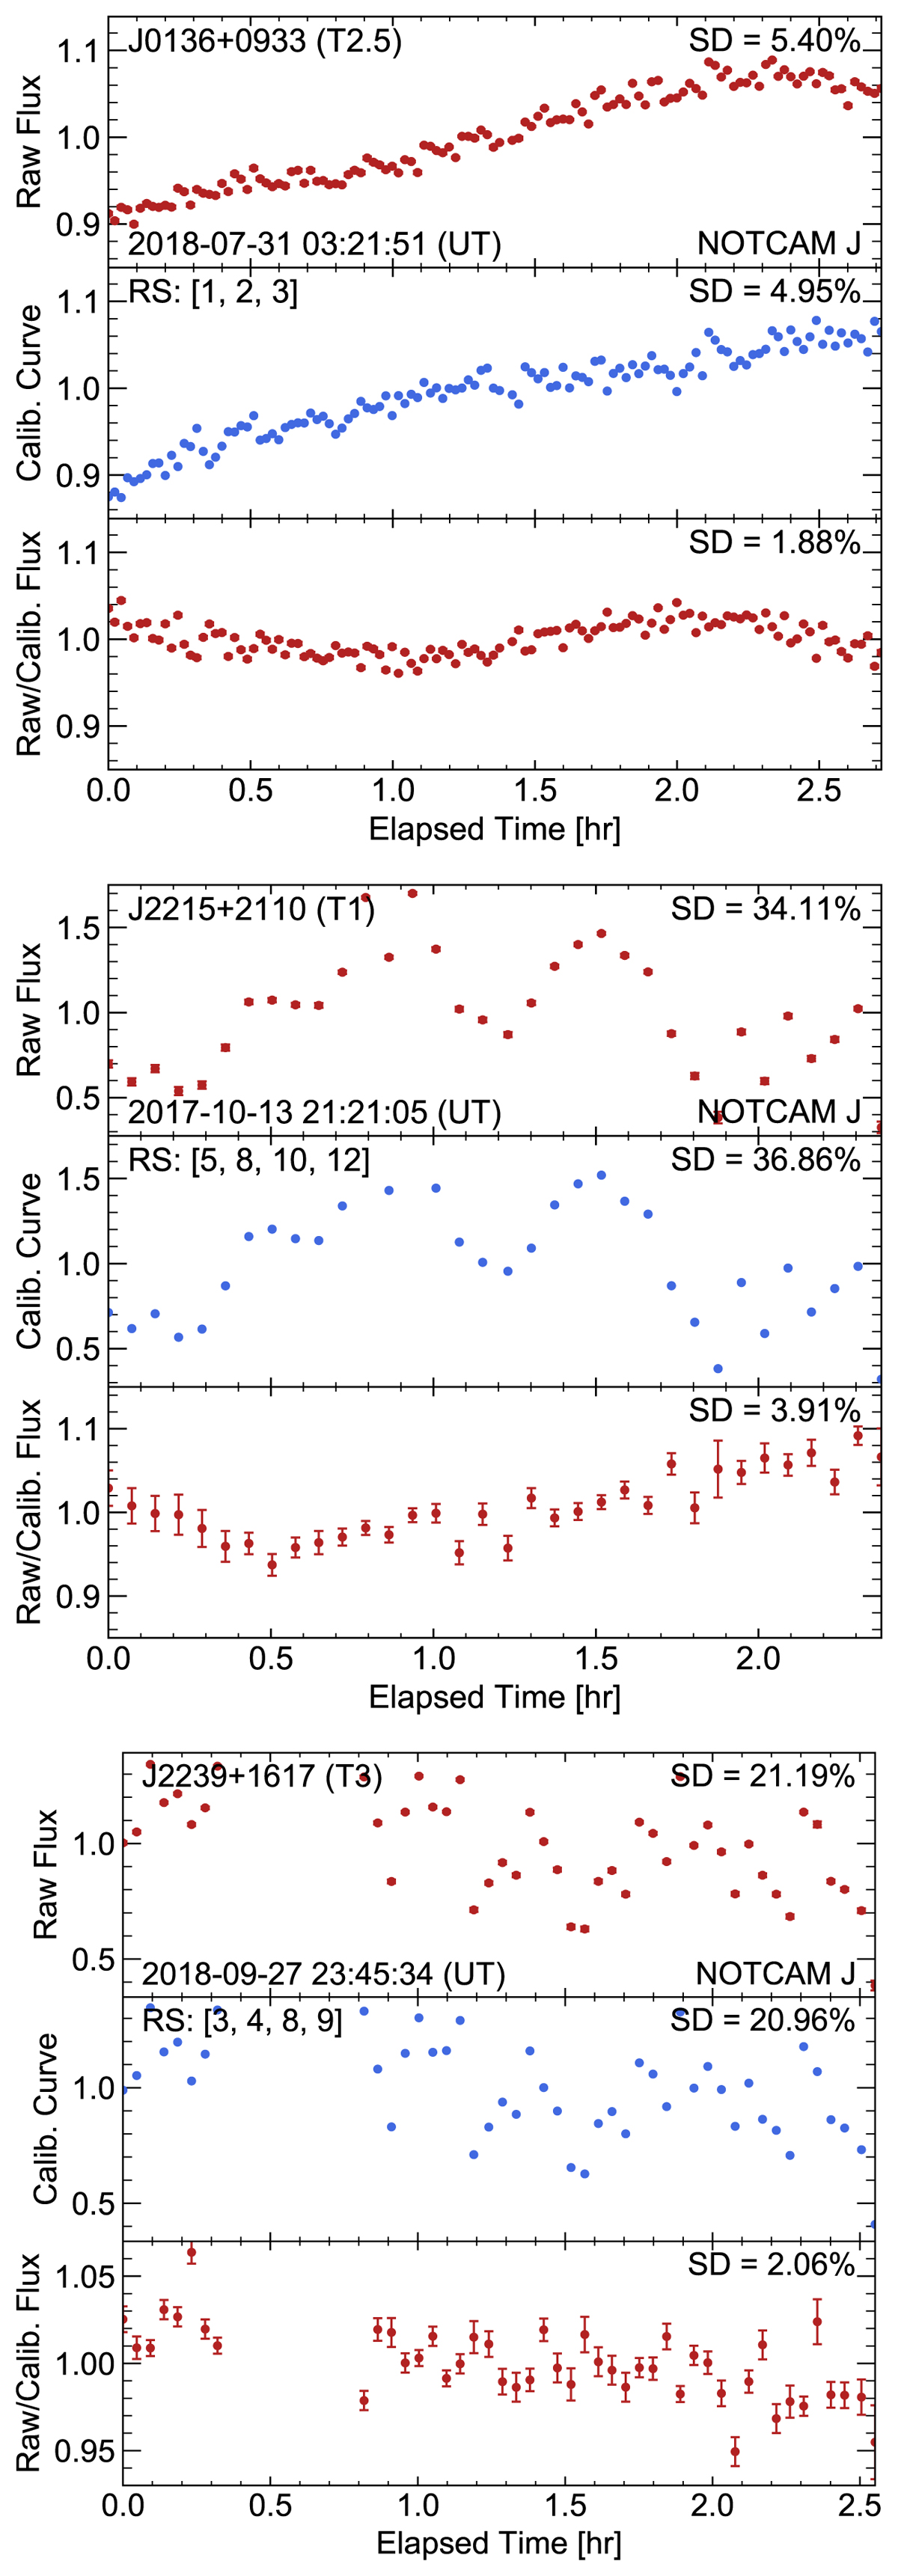
Three-panel figures showing the differential photometry at work for J0136, J2215 and J2239 respectively. Axis scales are preserved between panels for illustrating the efficiency of the process, and detailed plots of detected variability are available in Sect. 4. (I) Top panel, in a given figure: normalised raw flux of the target after aperture photometry, with error bars and the standard deviation (SD) of the light curve. (II) Middle panel: calibration or reference light curve created by median combining the normalised raw light curves of the reference stars (RS) indicated in the panel. (III) Bottom panel: relative differential photometry of the target, obtained by dividing the top panel light curve with the middle panel light curve.
Current usage metrics show cumulative count of Article Views (full-text article views including HTML views, PDF and ePub downloads, according to the available data) and Abstracts Views on Vision4Press platform.
Data correspond to usage on the plateform after 2015. The current usage metrics is available 48-96 hours after online publication and is updated daily on week days.
Initial download of the metrics may take a while.