Fig. 3
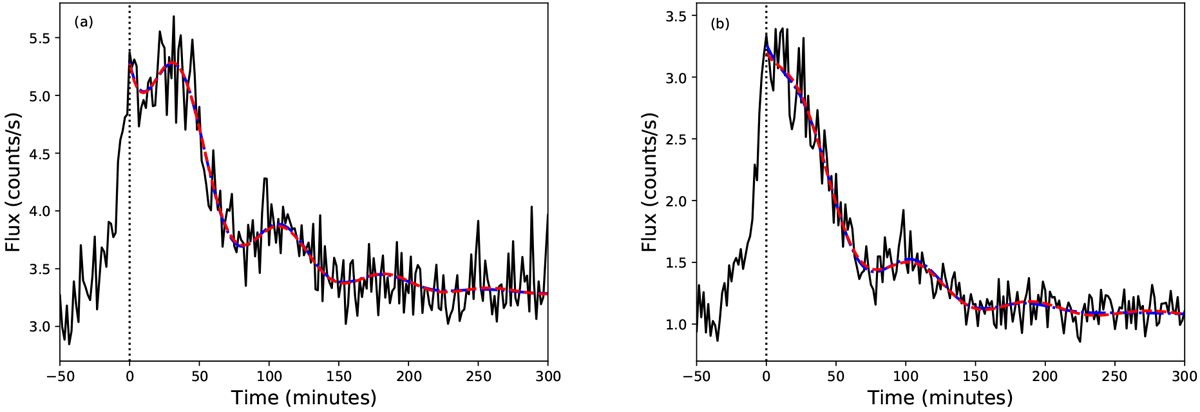
Panel a: flare lightcurve (black, solid) for low-energy-band data (0.2–1.0 keV). Panel b: flare lightcurve (black, solid) for high-energy-band data (1.0–12.0 keV). Also plotted in both panels are fits to the lightcurves consisting of the sum of an exponential decay term and a decaying sinusoid. The red, dashed line shows the fit when the decay of the sinusoid was described by an exponential, while the blue, dot-dashed curved shows the fit when the decay of the sinusoid was described by a Gaussian. We note that the blue and red curves are almost identical and, therefore, difficult to distinguish. The vertical dotted line highlights t = 0 min, which was determined from the total energy band.
Current usage metrics show cumulative count of Article Views (full-text article views including HTML views, PDF and ePub downloads, according to the available data) and Abstracts Views on Vision4Press platform.
Data correspond to usage on the plateform after 2015. The current usage metrics is available 48-96 hours after online publication and is updated daily on week days.
Initial download of the metrics may take a while.