Fig. 2
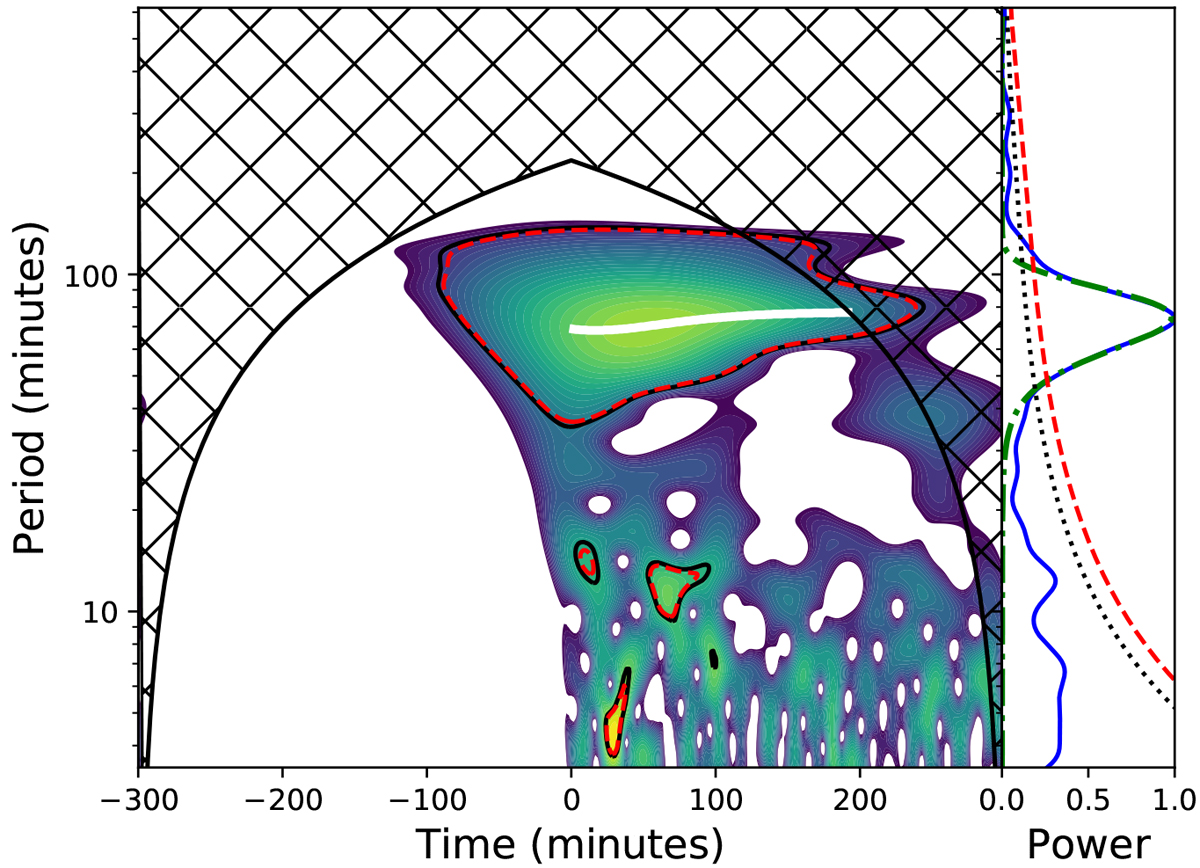
Wavelet transform of residuals for total energy band. Black solid contours indicate the standard 99% significance levels, while red dashed contours indicate 99% significance levels modified by the recommendations of Auchère et al. (2016). The white line indicates the ridge of maximum power, which evolves from 70 min at t = 0 to 77 min at t = 190 min. Black hatching and associated arcs indicate the cone of influence, where edge effects become important. Observed features confined to this cone are disregarded. Also plotted on the right is the global wavelet. The black-dotted line indicates the standard 99% significance level and the red-dashed line indicates the modified 99% significance level. The green dot-dashed curve represents a best fit to the main peak based on a Gaussian shape.
Current usage metrics show cumulative count of Article Views (full-text article views including HTML views, PDF and ePub downloads, according to the available data) and Abstracts Views on Vision4Press platform.
Data correspond to usage on the plateform after 2015. The current usage metrics is available 48-96 hours after online publication and is updated daily on week days.
Initial download of the metrics may take a while.