Fig. C.1
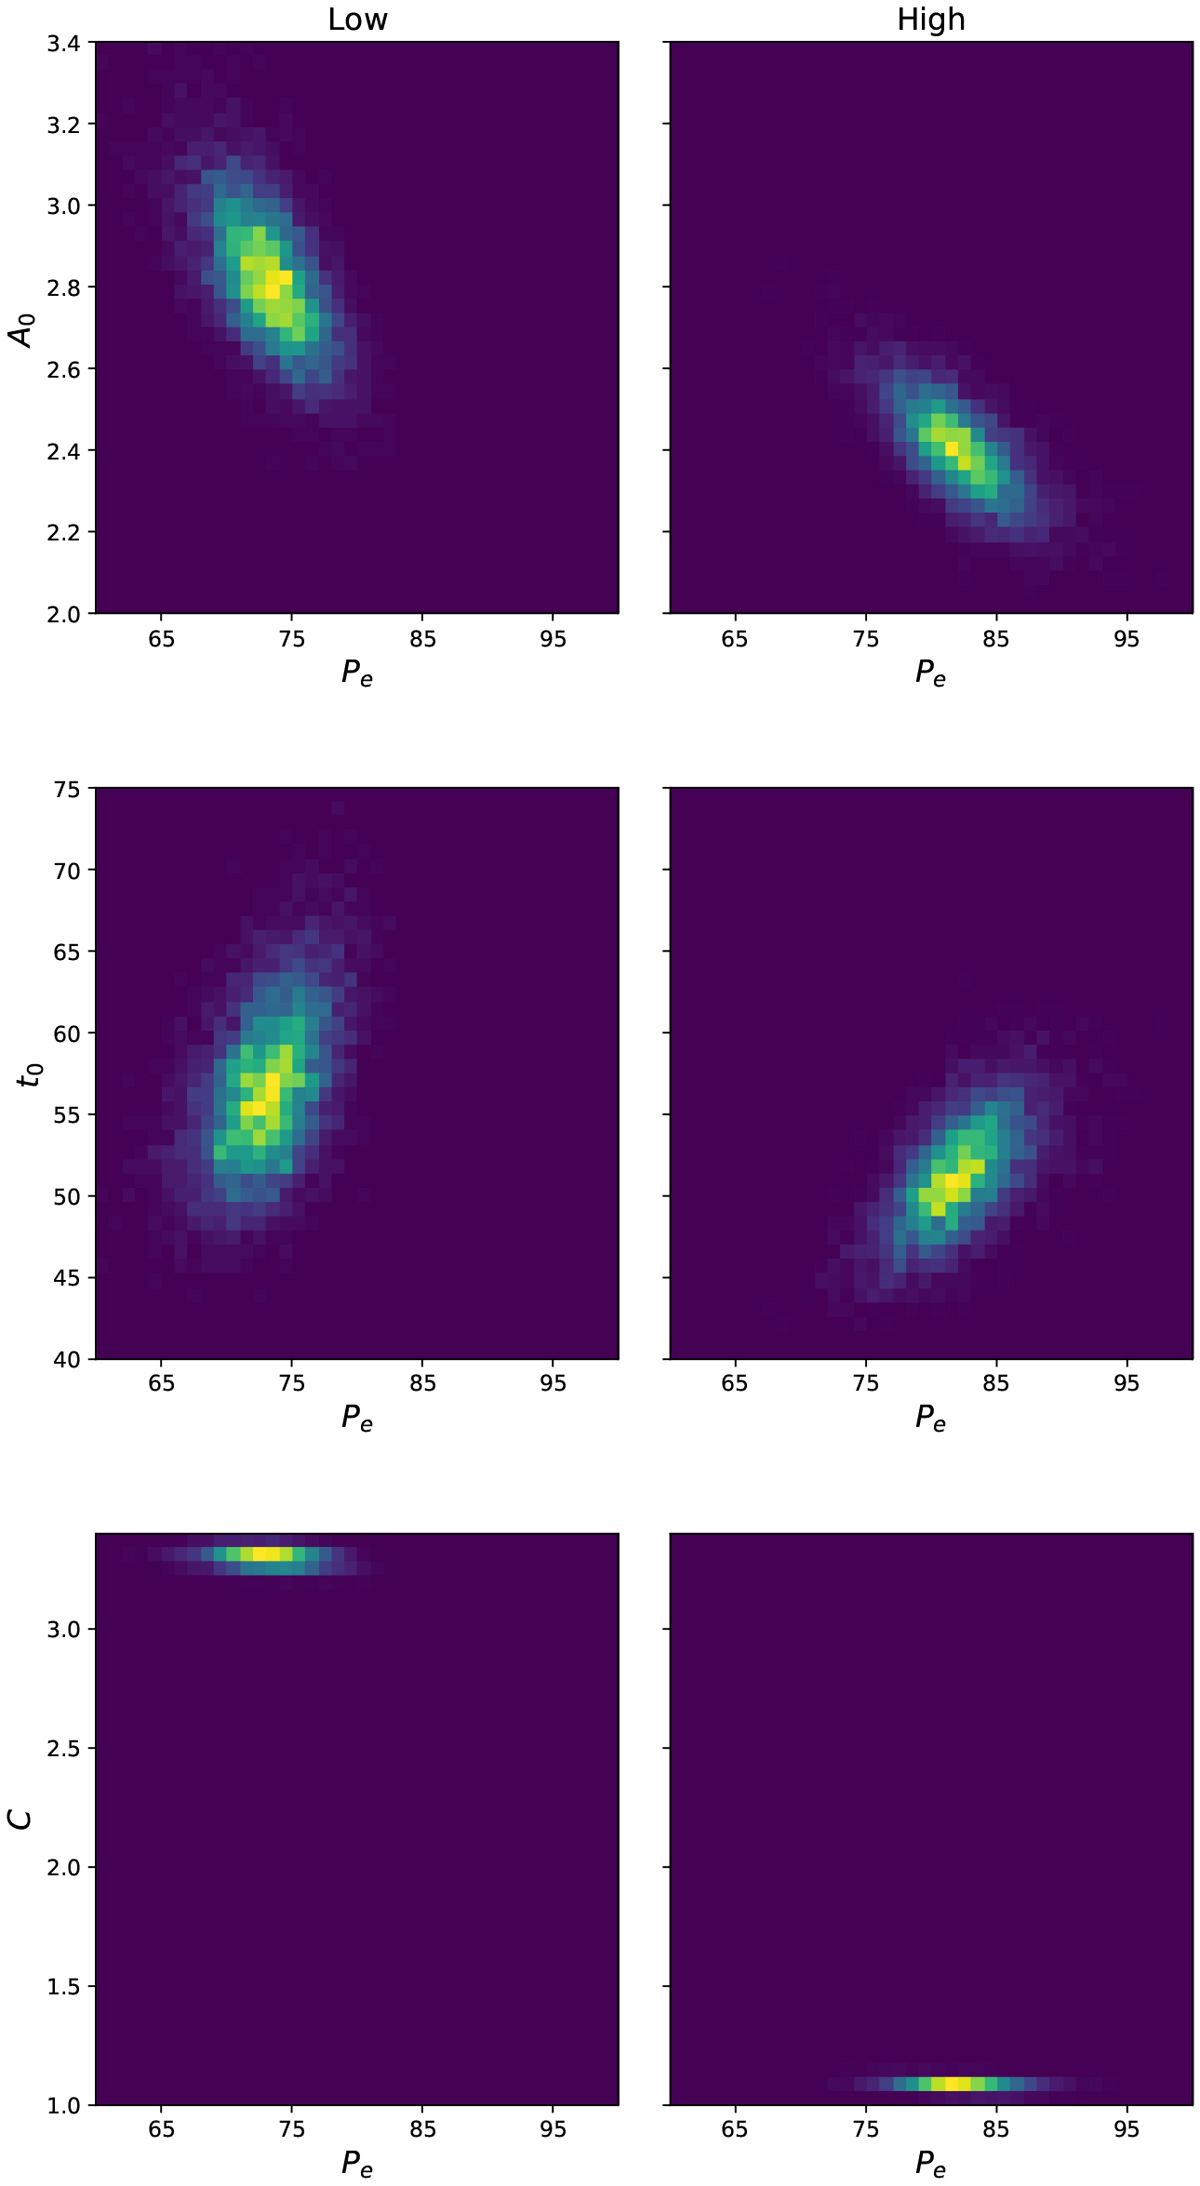
Two-dimensional histograms of full flare fit parameters obtained when QPP with exponentially-decaying amplitudes were fitted to data from congruent energy bands. Left-hand panels: low-energy band (0.2–1.0 keV) and right-hand panels: high-energy band (1.0–12.0 keV). In all panels, horizontal axes are fitted period of the QPP, Pe. In top row, vertical axes are amplitudes of the flare, A0; in middle panels, vertical axes are decay times of the flare, t0; and in bottom panels, vertical axes are constant offsets, C.
Current usage metrics show cumulative count of Article Views (full-text article views including HTML views, PDF and ePub downloads, according to the available data) and Abstracts Views on Vision4Press platform.
Data correspond to usage on the plateform after 2015. The current usage metrics is available 48-96 hours after online publication and is updated daily on week days.
Initial download of the metrics may take a while.