Open Access
Fig. 9
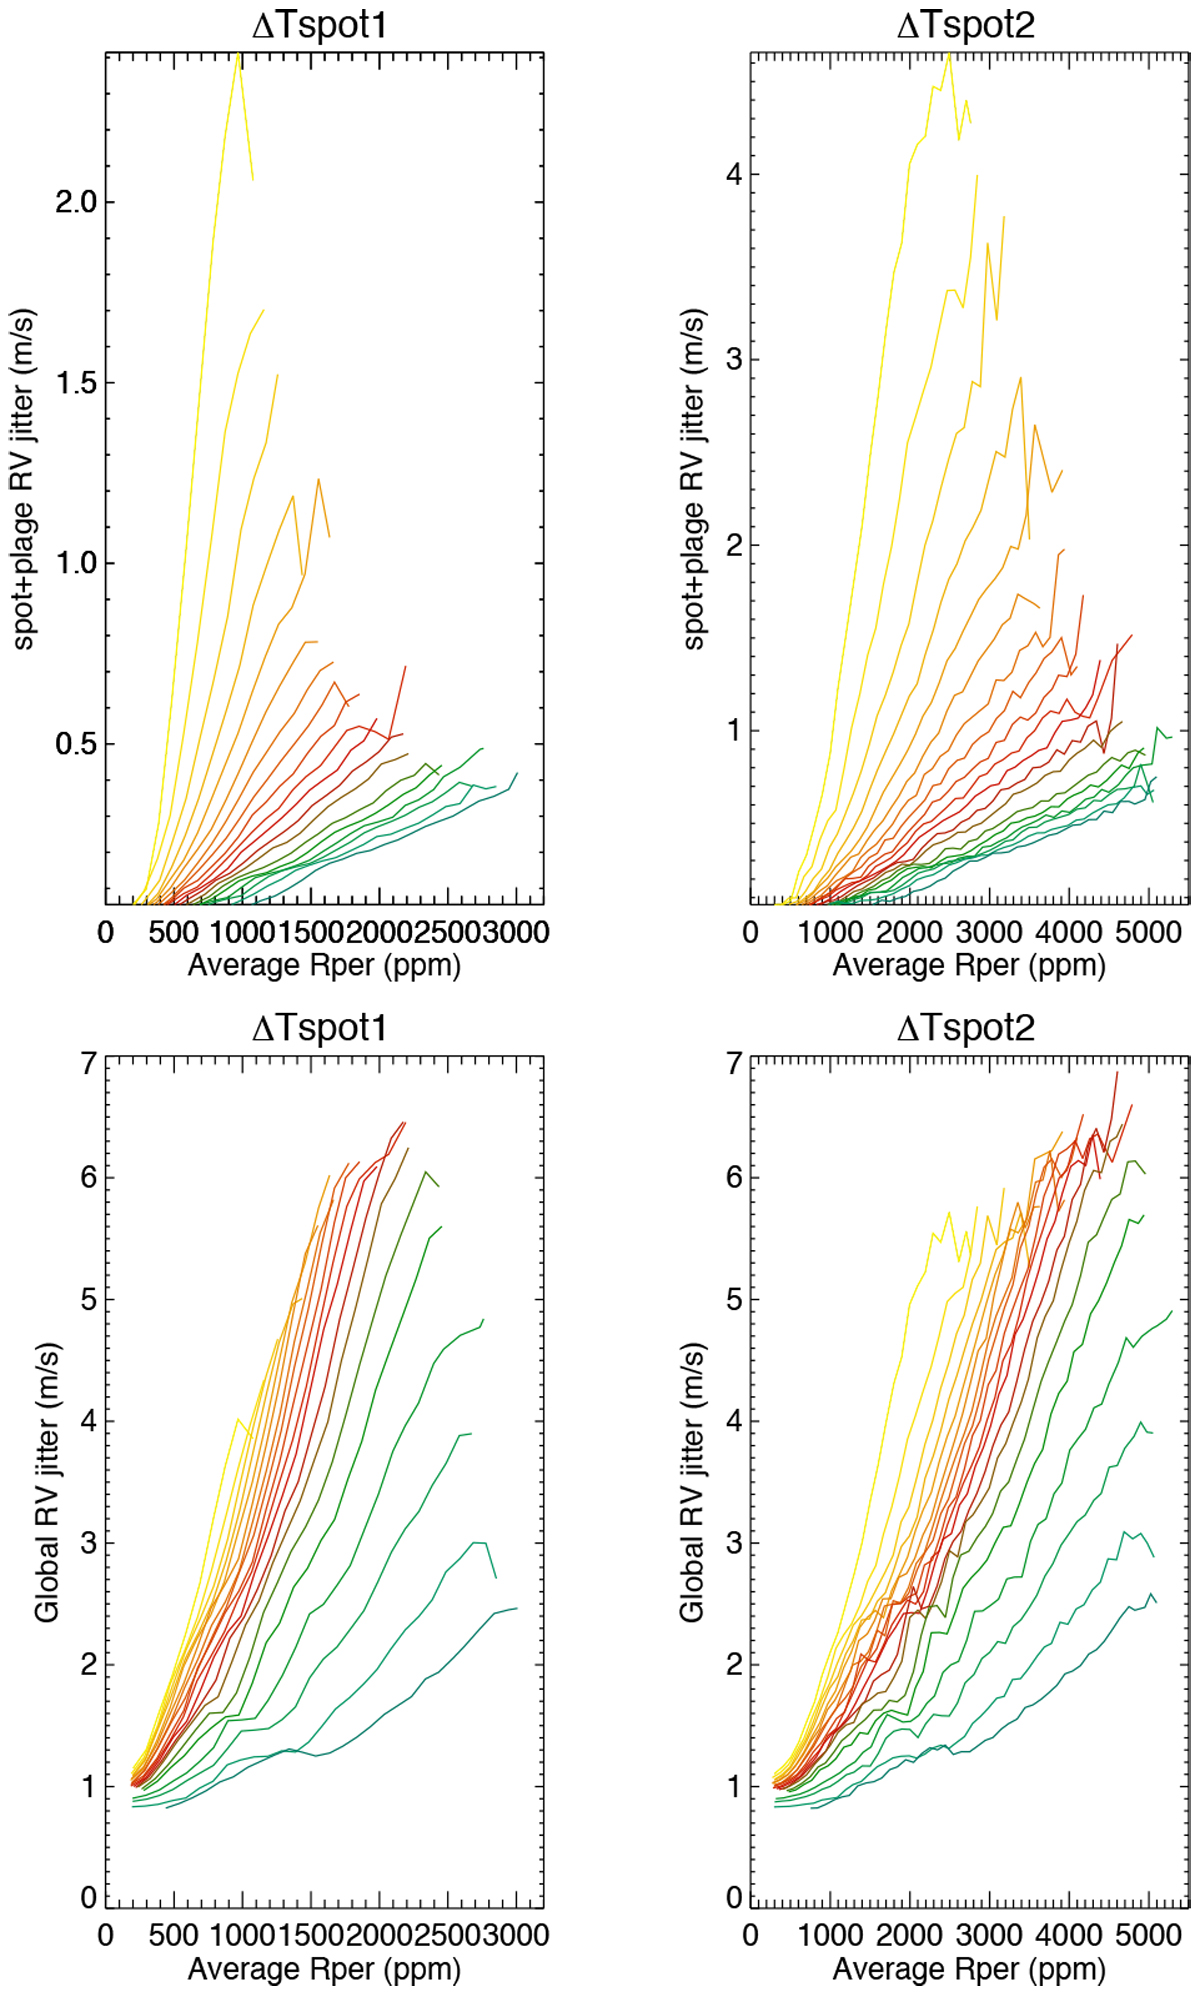
RV jitter vs. Rper (binned), for 19 spectral types (color code similar to Fig. 1), for ΔTspot1 (left) and ΔTspot2 (right). Upper panels: RV jitter due to spots and plages. Lower panels: full RV jitter (activity, oscillation+granulation+supergranulation averaged over six hours, 0.6 m/s white noise).
Current usage metrics show cumulative count of Article Views (full-text article views including HTML views, PDF and ePub downloads, according to the available data) and Abstracts Views on Vision4Press platform.
Data correspond to usage on the plateform after 2015. The current usage metrics is available 48-96 hours after online publication and is updated daily on week days.
Initial download of the metrics may take a while.