Open Access
Fig. 3
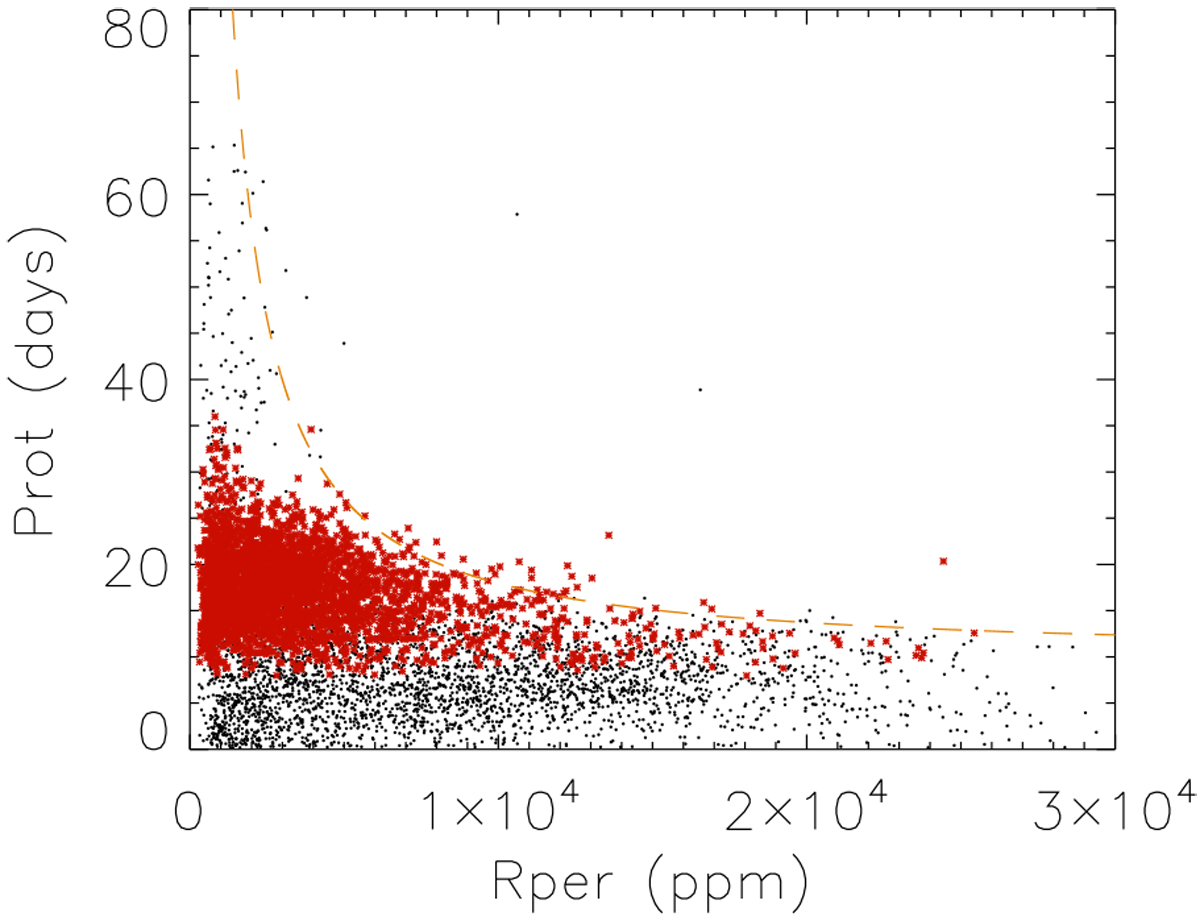
Prot vs. Rper (from McQuillan et al. 2014), for stars with Teff in 5600–6000 K range. Stars with Prot in the rangecorresponding to our simulations are highlighted in red. The orange dotted line indicates the approximate position of the upper envelope.
Current usage metrics show cumulative count of Article Views (full-text article views including HTML views, PDF and ePub downloads, according to the available data) and Abstracts Views on Vision4Press platform.
Data correspond to usage on the plateform after 2015. The current usage metrics is available 48-96 hours after online publication and is updated daily on week days.
Initial download of the metrics may take a while.