Fig. 2
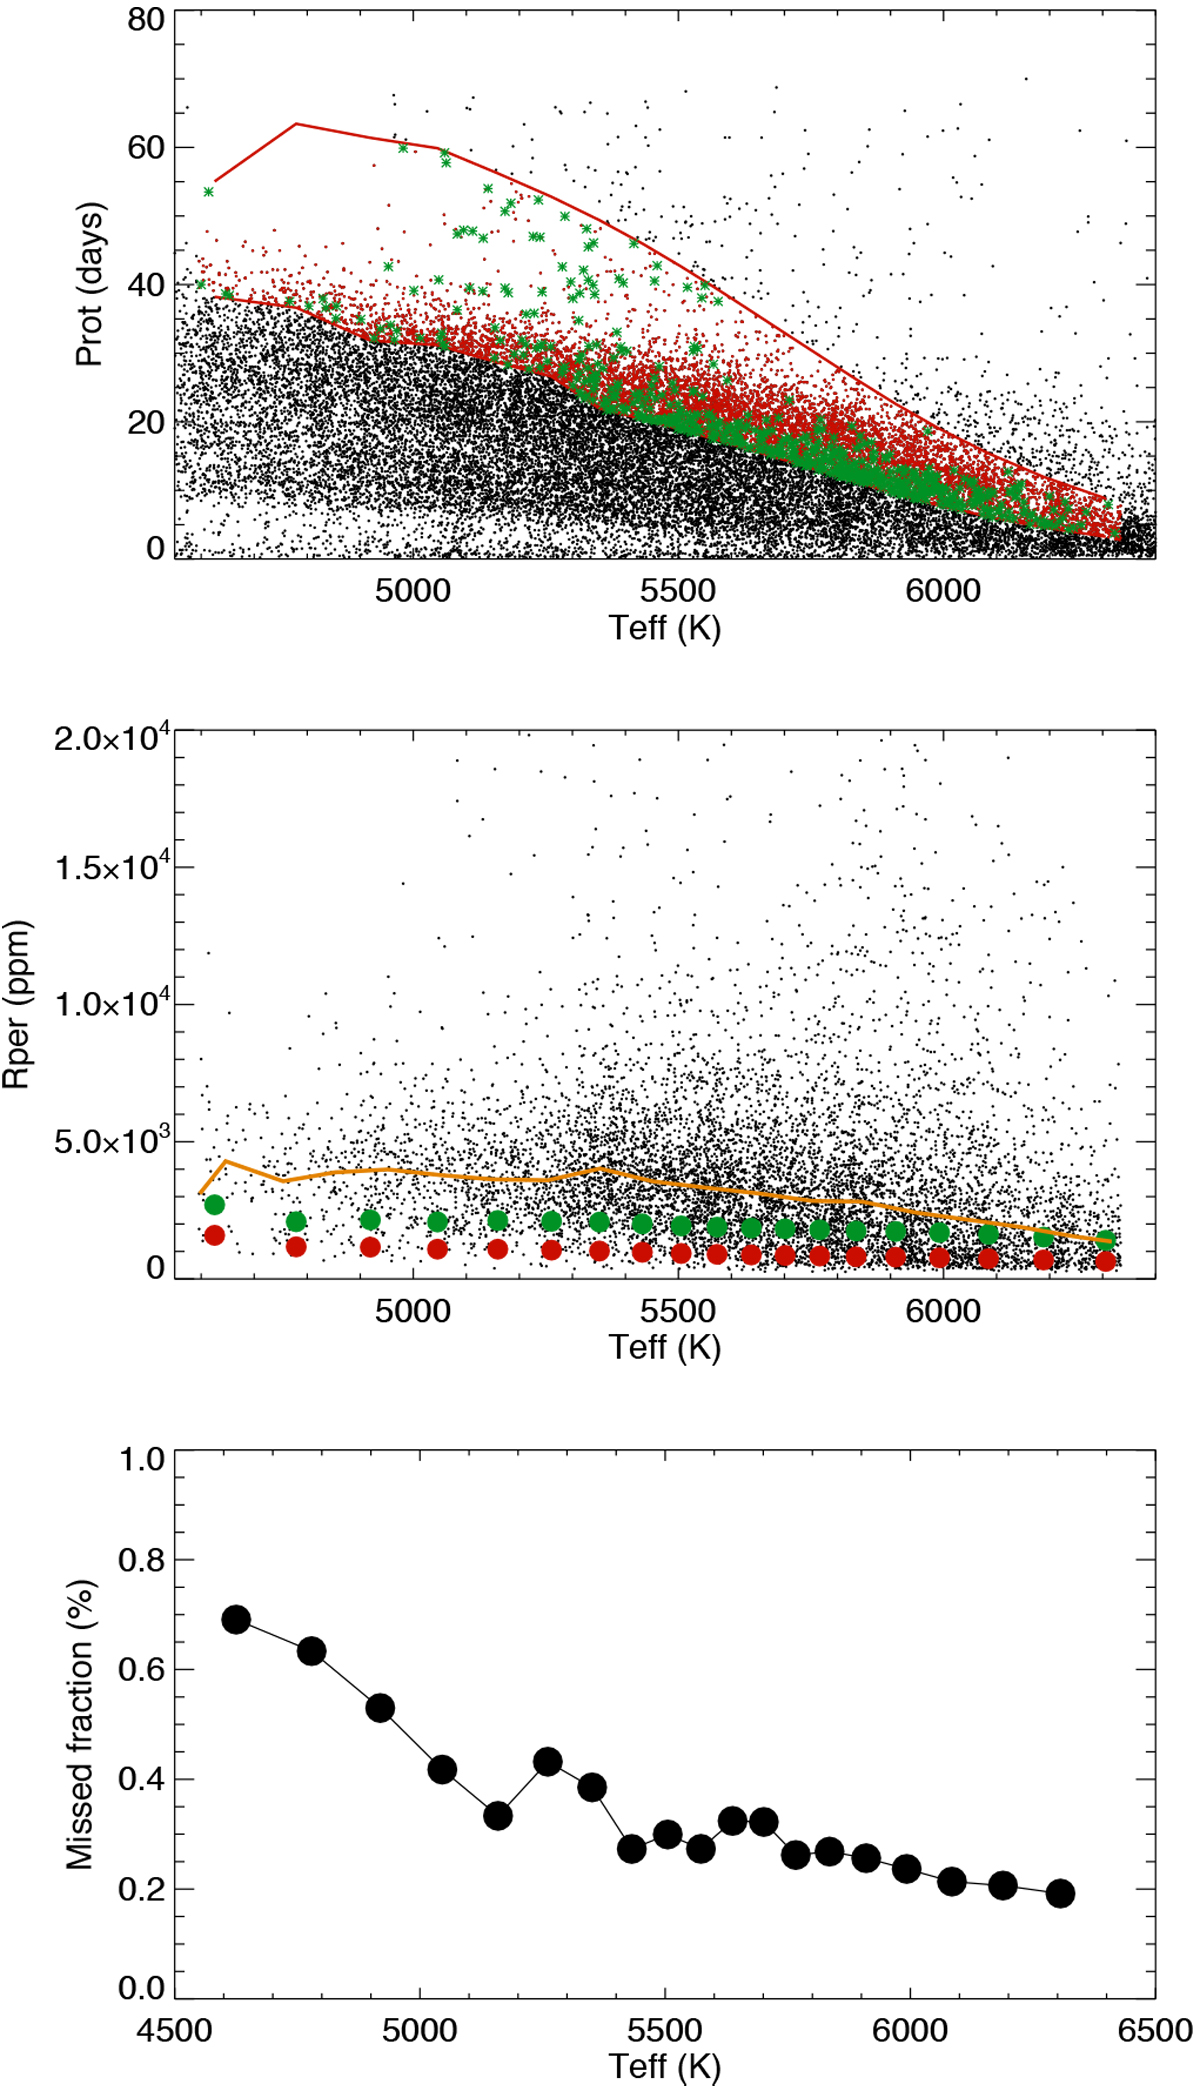
Prot (from McQuillan et al. 2014), Rper, and fraction of missing stars vs. Teff. Upper panel: the two red curves indicate our lower and upper boundaries in Prot. The red dotsindicate stars within this Prot range and green dots indicate stars within this Prot range and Rper above 8000 ppm. Middle panel: only stars within our Prot range for each spectral type are shown. The red (resp. green) points represent the median Rper from our simulations vs. Teff, for ΔTspot1 (resp. ΔTspot2). The orange line is the median of the observed values within each bin. Lower panel: only stars within our Prot range for each spectral type are shown.
Current usage metrics show cumulative count of Article Views (full-text article views including HTML views, PDF and ePub downloads, according to the available data) and Abstracts Views on Vision4Press platform.
Data correspond to usage on the plateform after 2015. The current usage metrics is available 48-96 hours after online publication and is updated daily on week days.
Initial download of the metrics may take a while.