Open Access
Fig. 18
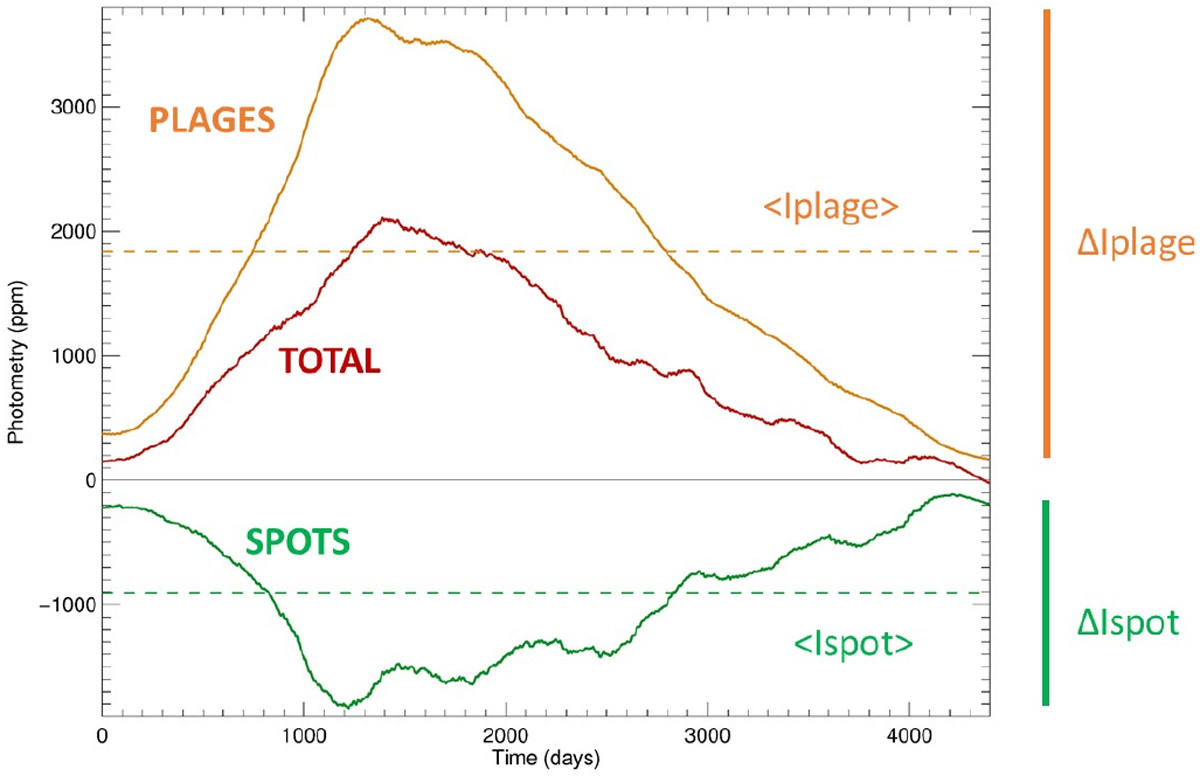
Typical long-term brightness variation due to plages (orange line). The green curve is for spots, and the red curve represents the sum of the two. The two horizontal lines correspond to the average (used to compute RI), while the vertical bars on the right side are the long-term amplitudes (used to compute RA).
Current usage metrics show cumulative count of Article Views (full-text article views including HTML views, PDF and ePub downloads, according to the available data) and Abstracts Views on Vision4Press platform.
Data correspond to usage on the plateform after 2015. The current usage metrics is available 48-96 hours after online publication and is updated daily on week days.
Initial download of the metrics may take a while.