Fig. 15
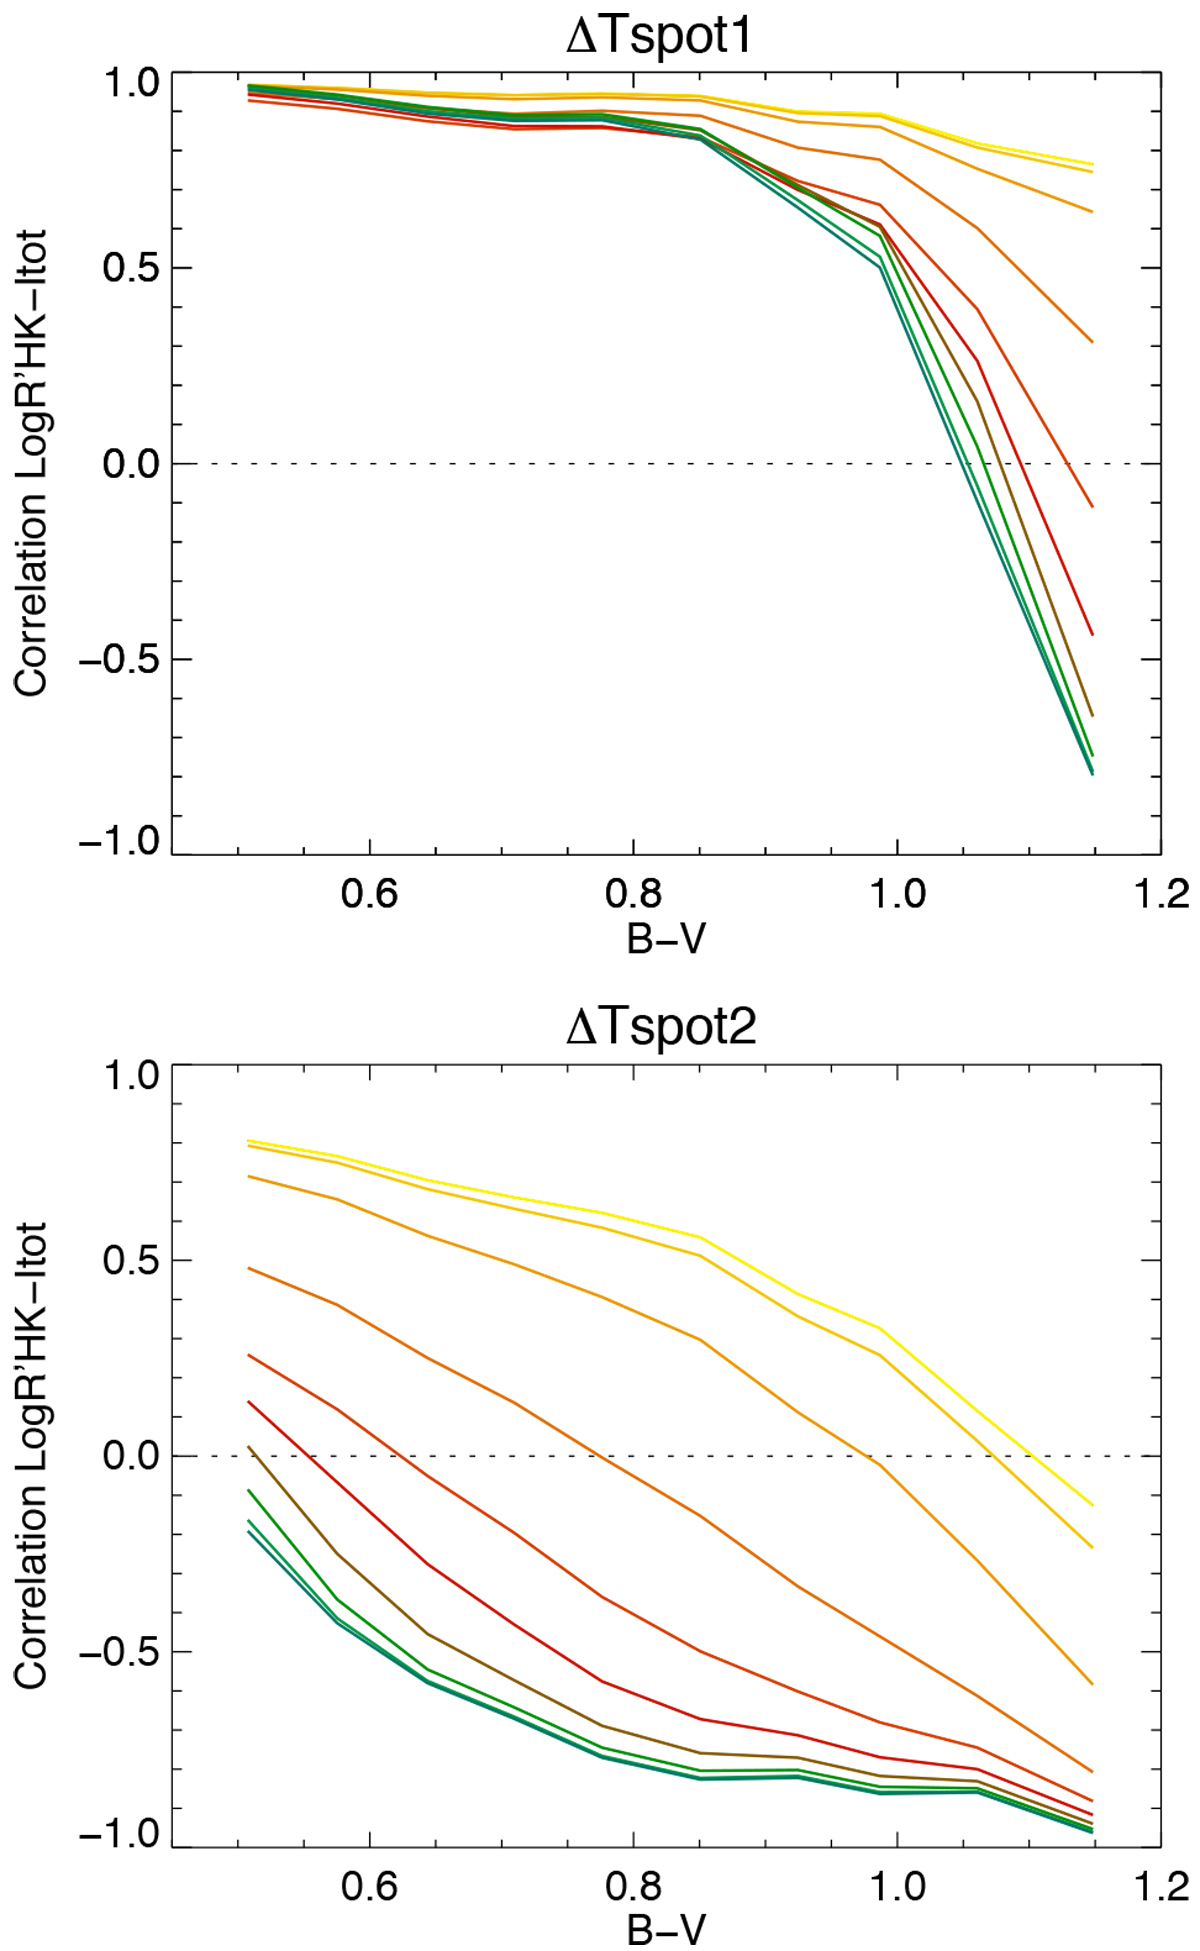
Correlation between Log ![]() and Itot binned in B−V for ΔTspot1 (upper panel) and ΔTspot2 (lower panel) and all stars in grid, for various inclinations. The color-coding corresponds to the inclination, from pole-on (i = 0°, yellow) to edge-on (i = 90°, blue), with light and dark orange corresponding to 20° and 30°, light and dark red to 40° and 50°, brown to 60°, and light and dark green to 70° and 80°.
and Itot binned in B−V for ΔTspot1 (upper panel) and ΔTspot2 (lower panel) and all stars in grid, for various inclinations. The color-coding corresponds to the inclination, from pole-on (i = 0°, yellow) to edge-on (i = 90°, blue), with light and dark orange corresponding to 20° and 30°, light and dark red to 40° and 50°, brown to 60°, and light and dark green to 70° and 80°.
Current usage metrics show cumulative count of Article Views (full-text article views including HTML views, PDF and ePub downloads, according to the available data) and Abstracts Views on Vision4Press platform.
Data correspond to usage on the plateform after 2015. The current usage metrics is available 48-96 hours after online publication and is updated daily on week days.
Initial download of the metrics may take a while.